
The cryptocurrency market is experiencing a waterfall crash, having dropped 20,000 points since the false breakout reminder at 98,000. The Asia-Pacific market is seeing widespread declines, with over 4,600 A-shares in the red and more than a hundred hitting the daily limit down. The South Korean stock market has fallen over 5%, triggering a circuit breaker, and the futures market is seeing a broad decline in commodities, with multiple contracts hitting the limit down.
U.S. stocks are also facing significant risks. In late January, it was warned that U.S. stocks would face a sharp decline. On the 30th, both gold and silver fell sharply, with silver dropping 26% in one day and gold falling 9%. Silver experienced its largest single-day drop in decades, and the logic for gold is similar. It was stated that where there is one, there is two, and where there is two, there is three. Gold is very close to reaching a temporary peak and historical high, with risks outweighing opportunities in the first half of the year.
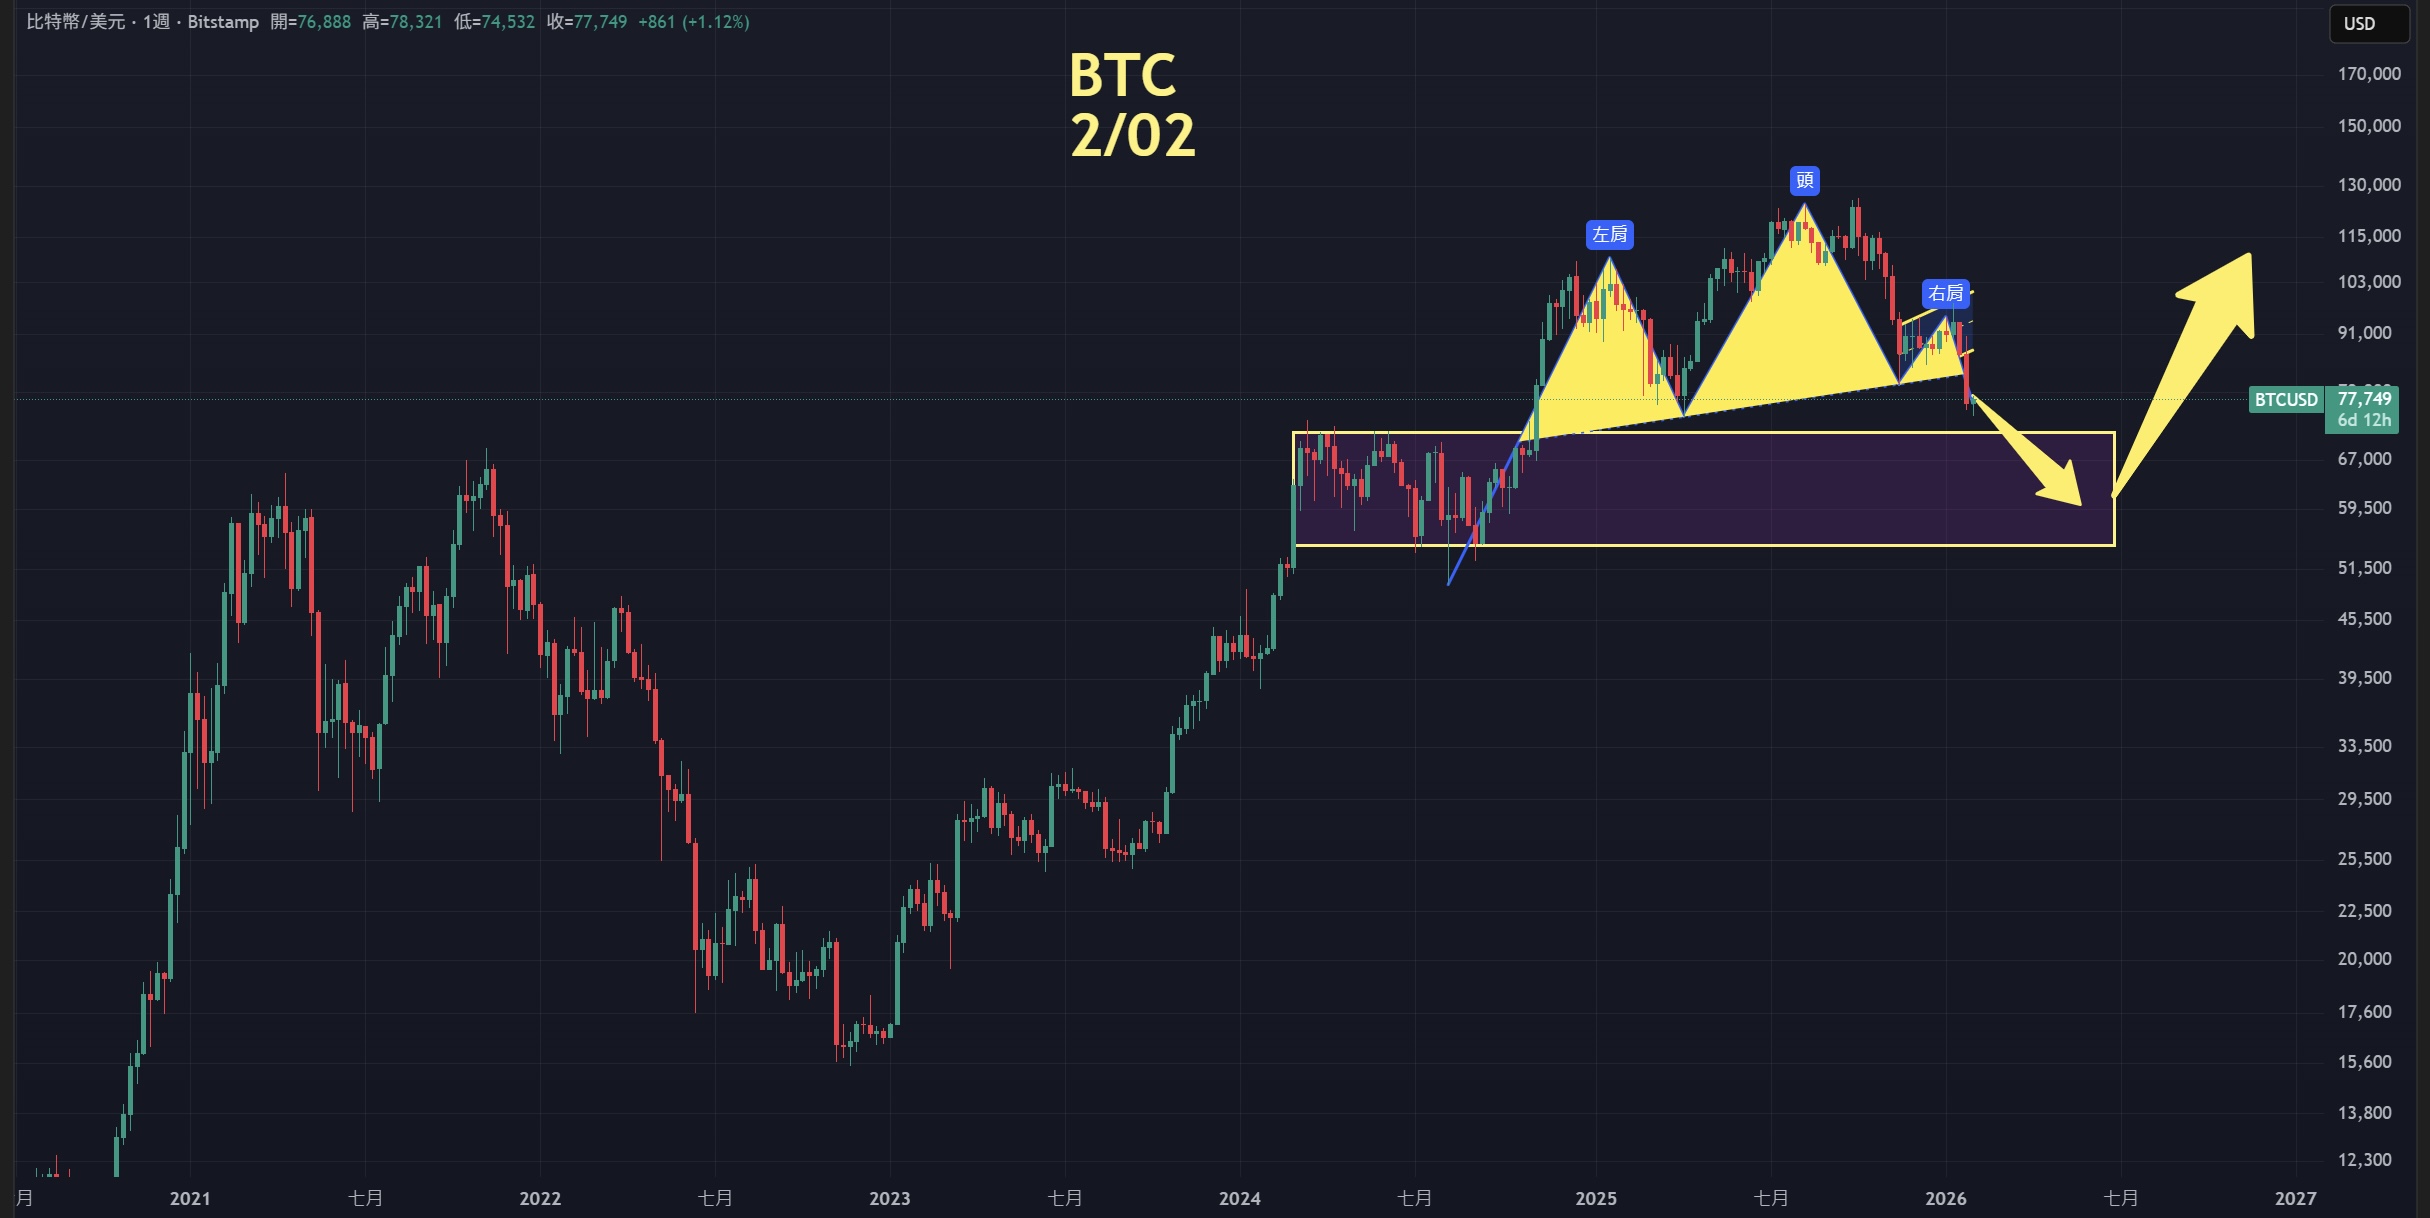
Bitcoin
Bitcoin has closed with a bearish candle for four consecutive months. This month opened with a decline, breaking below the MA20 on the monthly chart, closing below 90,500, which is even lower than the 92,000 mentioned earlier. Therefore, the downtrend remains unchanged, and any rebounds should be viewed as bearish.
Currently, the price has dropped to 74,500, with short-term support on the daily chart, but there are still no signs of a bottom. The entire weekly and monthly charts are forming a head and shoulders pattern. If a proportional decline occurs, the probability of dropping to 50,000 to 60,000 increases. This area is also a dense trading zone from the 24-year oscillation of 8 months. If it drops to this range, it could be a good opportunity for medium to long-term positioning.
Support: 50,000—60,000
Resistance: 83,000—90,000
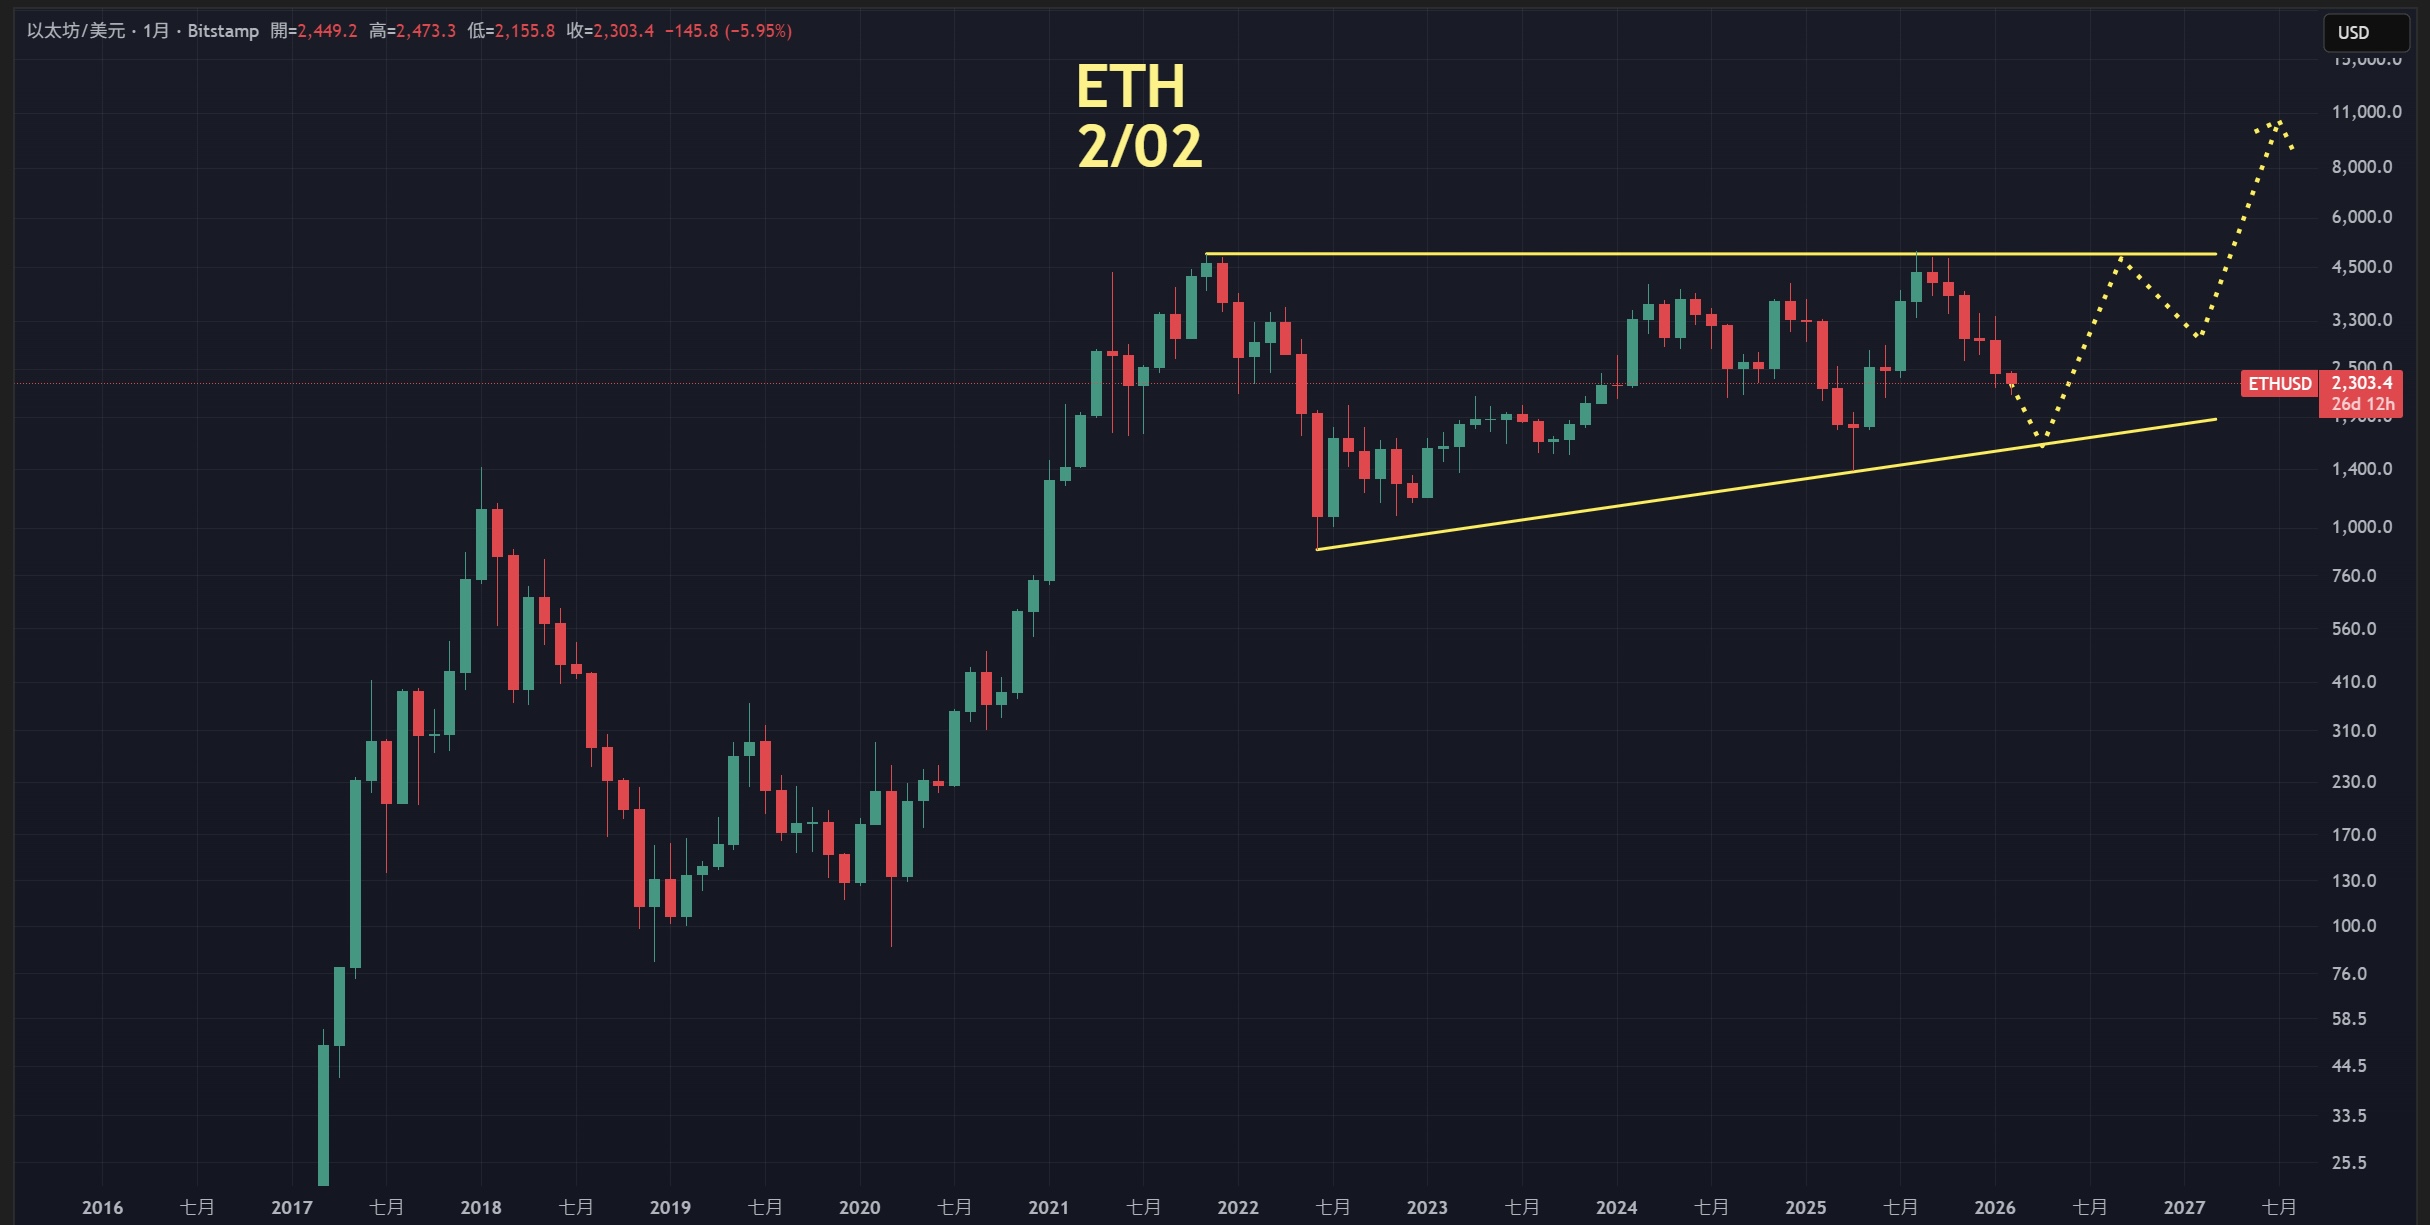
Ethereum
Ethereum has seen five consecutive monthly declines, with the monthly MACD returning to the zero axis. The weekly MACD histogram is increasing, and the fast and slow lines continue to turn downward, indicating a bearish outlook on both the monthly and weekly levels.
The daily price has dropped to 2,157, essentially retracing the entire increase from 1,385 to 4,956. If a proportional decline occurs, it is possible to drop to around 1,000 or even into the three-digit range for Ethereum. However, from the weekly and monthly perspectives, a large-scale converging triangle oscillation cannot be ruled out. If it breaks above 5,000 later, it could lead to a multi-fold increase, so it is crucial to grasp the lowest point of this decline.
Support: 880—1,000
Resistance: 2,700—3,000
If you like my views, please like, comment, and share. Let's navigate through the bull and bear markets together!!!
The article is time-sensitive and for reference only, with real-time updates.
Focusing on K-line technical research, sharing global investment opportunities. Public account: BTC Trading Master Fusu

免责声明:本文章仅代表作者个人观点,不代表本平台的立场和观点。本文章仅供信息分享,不构成对任何人的任何投资建议。用户与作者之间的任何争议,与本平台无关。如网页中刊载的文章或图片涉及侵权,请提供相关的权利证明和身份证明发送邮件到support@aicoin.com,本平台相关工作人员将会进行核查。