News: The Clash of Risk Aversion Sentiment and Policy Game
New Variables in Geopolitical Situation: According to the latest reports, the U.S. has proposed a ceasefire plan with 15 conditions to Iran through intermediaries. Although the market expects the conflict to cool down, the harsh conditions regarding the opening of the Strait of Hormuz remain uncertain. This "negotiation game" has triggered a secondary entry of risk-averse funds, pushing gold prices to quickly recover after an oversold situation.
Liquidity Easing Signal: Today, the People's Bank of China conducted a 500 billion MLF operation, achieving a "larger quantity at par" renewal, signaling liquidity support to the market. Additionally, the long-term logic of global central banks increasing gold holdings is strengthening; although it faced pressure due to inflation path games in the short term, the physical support remains solid.
Market Sentiment Recovery: After gold prices fell over 20% from the January high into a technical bear market, the demand for a rebound due to overselling exploded today, with some shorts covering and buy-the-dip positions (BTFD) resonating, leading to a rapid price increase.
Technical Analysis: Key Support Levels and Volatile Rebound
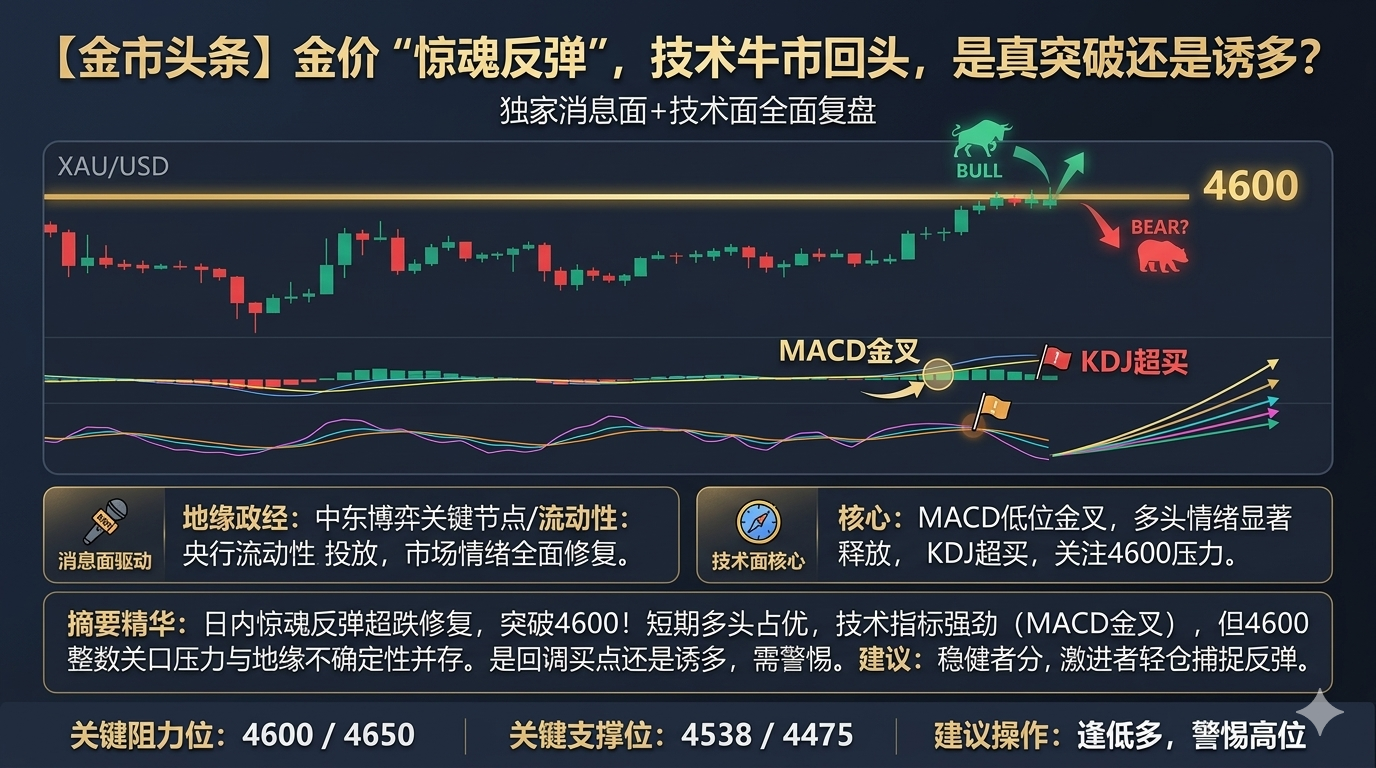
XAU/USD 1 Hour Chart shows a clear stabilization and counterattack pattern:Price Action and Moving Averages: After bottoming today, gold prices exhibited a strong upward rebound with a significant slope, currently standing above the MA(24) (purple line) and MA(52) (blue line), closing near 4559.4. Although it still faces resistance from the MA(120) (120-period moving average) above (approximately 4553.2 has been reclaimed, currently testing the psychological level of 4600), the short-term downward pressure has significantly alleviated.
MACD Indicator: MACD has formed a significant low-position golden cross below the zero line, and the green momentum bars (bullish) are continuing to expand. This indicates that bullish momentum is dominant in the short term, and the rebound trend has not yet ended.
KDJ Indicator: The J line has entered the overbought zone (J: 51.00, K: 68.89), suggesting that the upward movement has been too rapid; although it remains under bullish control, caution is necessary regarding the narrow fluctuations near the 4600 level.
Support and Resistance Levels:
Strong Resistance: 4592.5 - 4600.0 (previous intraday highs and round numbers).
Key Support: 4538.8 (intraday low) and 4475.3 (near the MA24 moving average).
Market Outlook and Operational Suggestions
Gold is currently in a stage of weakening in the larger trend and repairing in smaller cycles.
The rally today feels more like a correction of the previous extreme decline.Bullish: If it can effectively stabilize above 4600 USD, gold prices are expected to attack the 50-day moving average resistance at 4800 USD.
Risk: Given that U.S. Treasury yields remain high and the Federal Reserve maintains a tightening tone, the "non-interest-bearing asset" nature of gold is still under pressure. If the rebound cannot break through the 4600-4650 range, caution is needed that this may be a "dead cat bounce" followed by a secondary decline.
Operational Tips: Cautious traders may focus on the gains and losses at the 4600 level; if the breakout fails, a small short position can be established; aggressive traders may consider long positions on a pullback supported by 4530, targeting the previous resistance area.
免责声明:本文章仅代表作者个人观点,不代表本平台的立场和观点。本文章仅供信息分享,不构成对任何人的任何投资建议。用户与作者之间的任何争议,与本平台无关。如网页中刊载的文章或图片涉及侵权,请提供相关的权利证明和身份证明发送邮件到support@aicoin.com,本平台相关工作人员将会进行核查。


