Charts
DataOn-chain
VIP
Market Cap
API
Rankings
CoinOSNew
CoinClaw🦞
Language
  • 简体中文
  • 繁体中文
  • English
Leader in global market data applications, committed to providing valuable information more efficiently.

Features

  • Real-time Data
  • Special Features
  • AI Grid

Services

  • News
  • Open Data(API)
  • Institutional Services

Downloads

  • Desktop
  • Android
  • iOS

Contact Us

  • Chat Room
  • Business Email
  • Official Email
  • Official Verification

Join Community

  • Telegram
  • Twitter
  • Discord

© Copyright 2013-2026. All rights reserved.

简体繁體English
|Legacy

BTC surged and then fell back, showing signs of fatigue. The battle at the 71,000 level intensifies. Will it decline further or reverse?

CN
CakeBaBa
Follow
8 days ago
AI summarizes in 5 seconds.

1. In-depth Technical Analysis (30min Chart)

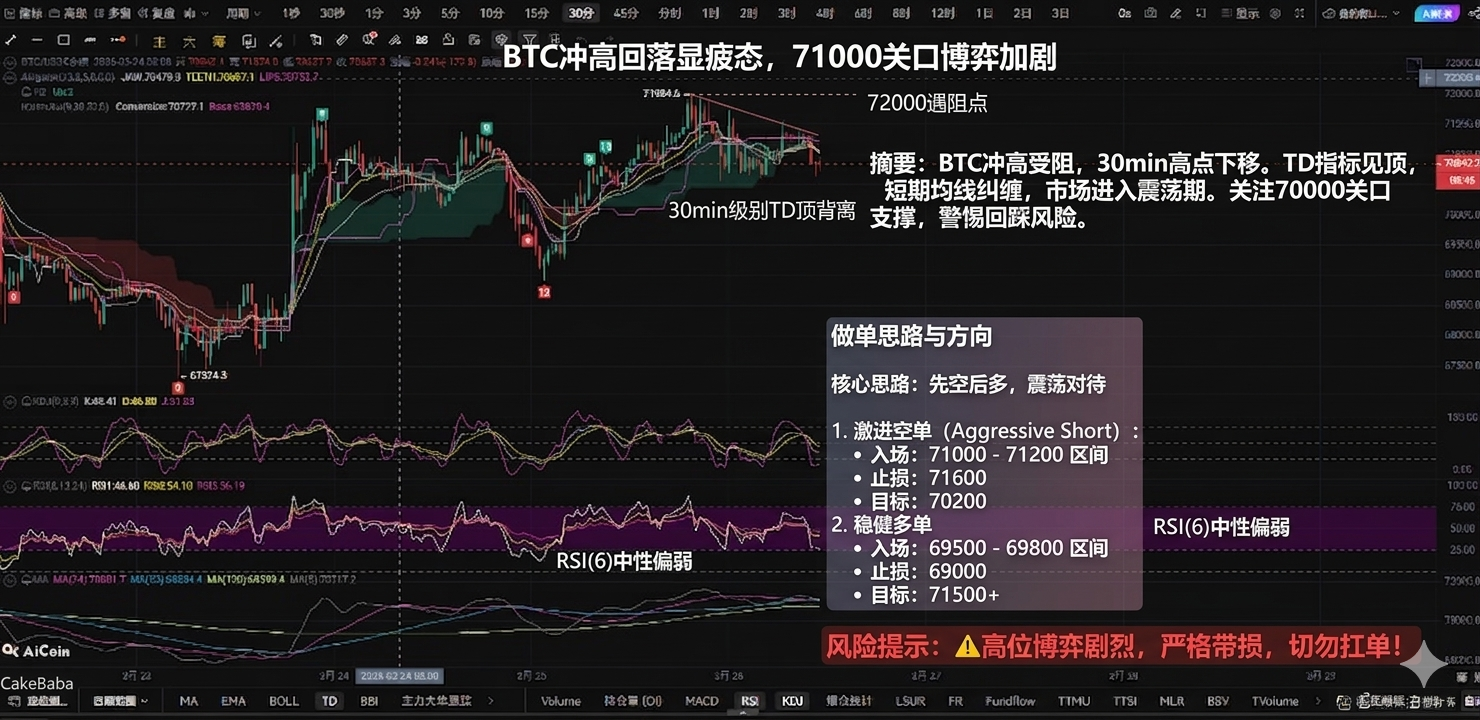
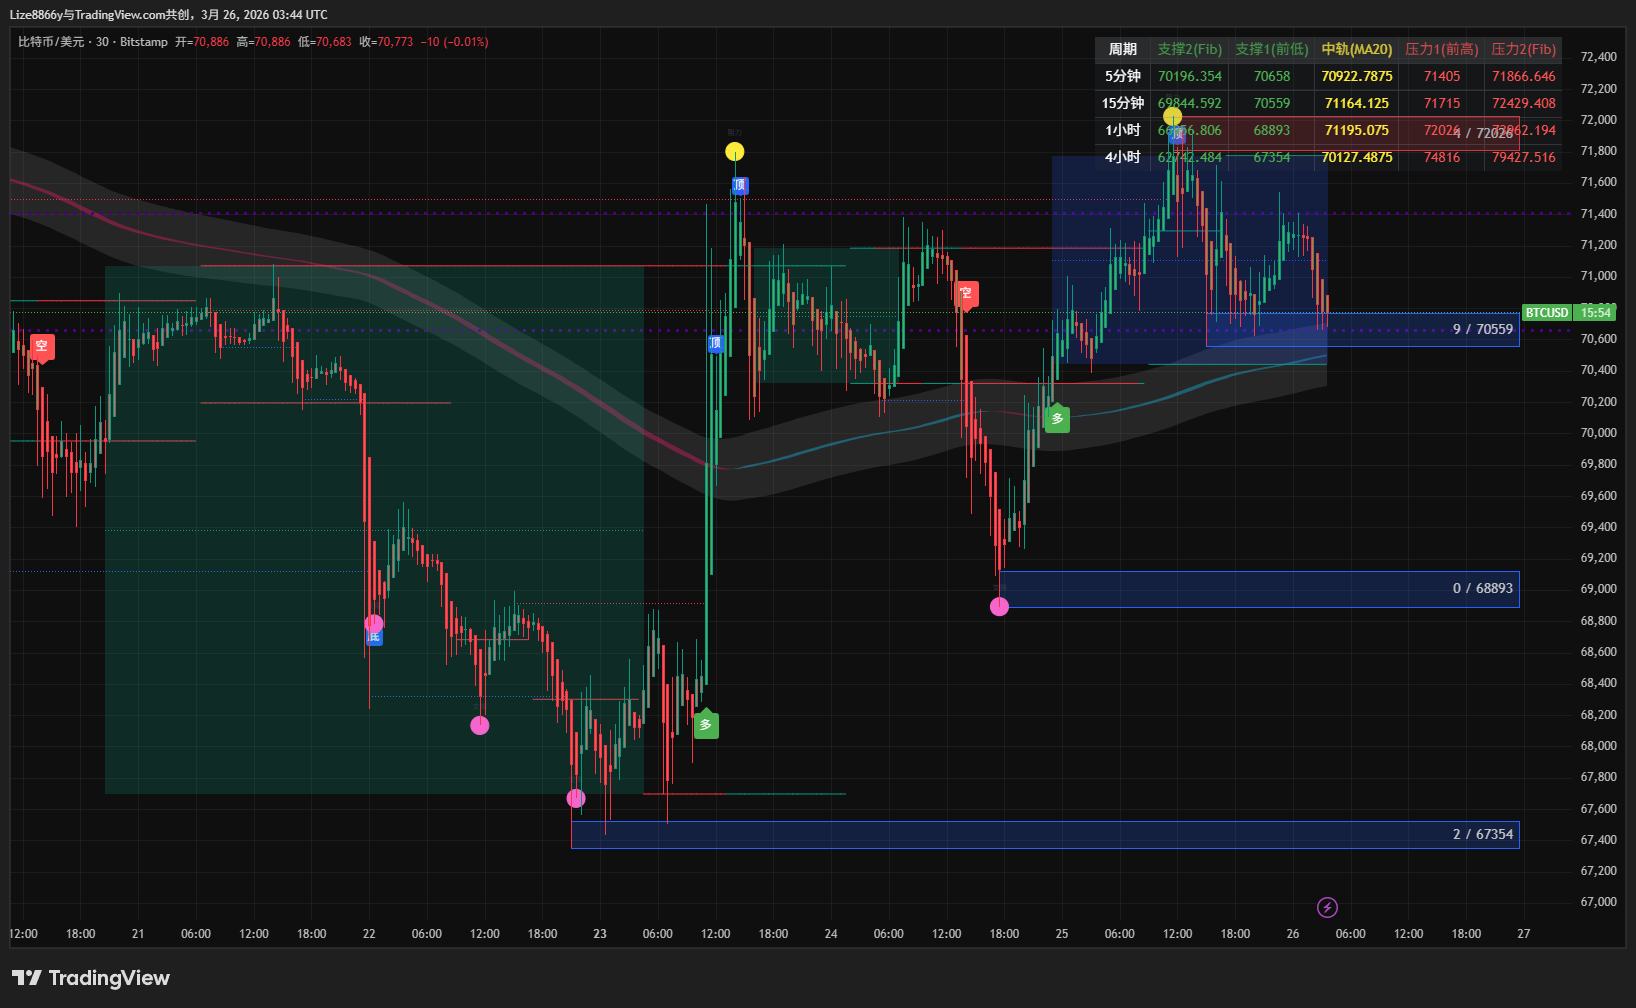
Trend Analysis: The price is currently operating around 70842. From the chart, BTC has experienced a rapid rise, and the highs are gradually decreasing (from 71984 to around 71500), forming a fluctuating downward channel.
Moving Average System (MA/Alligator): MA(24) is currently at 70801, and the price is closely following this moving average, indicating a balance between bulls and bears in the short term. However, the Alligator line shows signs of tightening, suggesting a new directional choice is imminent.
TD Indicator: After the appearance of green “9” and “13” counts, the price has undergone different degrees of pullbacks, indicating significant selling pressure at high levels.
RSI: RSI(6) is at about 46.60, within a neutral and weak range, and has not entered the oversold zone, implying there is still room for downward movement.
KDJ: The J line is pointing down, and the KD line is converging around 50, increasing the expectation of a death cross.
Key Levels:
Resistance Level: 71500 / 71984 (previous high point pressure) Support Level: 70400 (moving average support) 69500

2. News Observation (March 26, 2026)
The market is cautious about the economic data to be released this week, leading some bullish funds to take profits at high levels.
Capital Flow: As Bitcoin stabilizes above 70,000, the trading volume among institutions has increased, and the inflow rate of ETFs has slowed, with the market currently driven by existing capital play.

3. Trading Direction and Strategy

Core Strategy:Short high and long low, primarily entering long positions on pullbacks to support levels.
Short Position (Betting on pullbacks) Entry: Near 71000 - 71200 with light positions split into batches.
Target: 70200 - 69800Stop Loss: Above 71600
Strategy: Capture the pullback momentum brought by the KDJ death cross on the 30-minute level.
Long Position (Following the trend)Entry: Range of 69500 - 69800
Target: 71500 - 72000Stop Loss: Below the integer level of 69000.
Strategy: Look for pullback support buying points in a large upward trend, utilizing the resonance support of clouds and MA120.
Risk Reminder: Currently in a high-level range, volatility may increase at any time. Please ensure to strictly maintain stop losses, and do not fully load on a single position💸

Pay attention to the comments from the host; deduct 1 for free use of the TV long and short indicators

免责声明:本文章仅代表作者个人观点,不代表本平台的立场和观点。本文章仅供信息分享,不构成对任何人的任何投资建议。用户与作者之间的任何争议,与本平台无关。如网页中刊载的文章或图片涉及侵权,请提供相关的权利证明和身份证明发送邮件到support@aicoin.com,本平台相关工作人员将会进行核查。

震荡行情滑点大?去Bybit体验极速现货撮合!
广告
|
|
APP
Windows
Mac
Share To

X

Telegram

Facebook

Reddit

CopyLink

|
|
APP
Windows
Mac
Share To

X

Telegram

Facebook

Reddit

CopyLink

Selected Articles by CakeBaBa

15 hours ago
ETH defends the 2000 mark: large holders crazily short vs TD9 bottom signal, will the Ethereum counterattack battle soon commence?
1 day ago
ETH is caught in a tug of war at the two thousand mark: the TD9 signal appears, is it a buying signal or a trap for the unsuspecting?
2 days ago
BTC April opens with a bang: Has it stabilized at 68000? Is April Fools' Day or a day of transformation?
View More

Table of Contents

|
|
APP
Windows
Mac
Share To

X

Telegram

Facebook

Reddit

CopyLink

Related Articles

avatar
avatar币圈院士
5 hours ago
Cryptocurrency Circle Academician: 4.4 Ethereum Daily Line Bottoming Out, 4-Hour Volatility, Key Entry Points for Long and Short Positions! Latest Market Analysis and Ideas Reference.
avatar
avatar币圈院士
5 hours ago
Cryptocurrency Expert: The mid-term trend of Bitcoin at 4.4 is downward, with short-term fluctuations and bottoming out, key points in the long-short game! Latest market analysis and thought reference.
avatar
avatar周彦灵
7 hours ago
Zhou Yanling: 4.4 Bitcoin (BTC) Ethereum (ETH) Today's Latest Trend Forecast Analysis and Trading Strategy
avatar
avatar币圈丽盈
7 hours ago
Cryptocurrency Circle: 4.4 Ethereum is closely tied to the lower Bollinger band, hanging by a thread, with 2050 becoming the ultimate battleground for bulls and bears! Latest market analysis and trading suggestions.
avatar
avatar币圈丽盈
7 hours ago
Cryptocurrency Liying: Bitcoin bullish momentum weakens at 4.4, but moving average support remains intact. Is it a trap or an opportunity? Latest market analysis and trading advice.
APP
Windows
Mac

X

Telegram

Facebook

Reddit

CopyLink