Original author / Castle Labs
Translation / Odaily Planet Daily Golem
Editor's note: This article systematically studies the differences in crude oil contract trading data on Hyperliquid and CME during weekdays and weekends, and draws some important conclusions. Currently, Hyperliquid cannot match CME in absolute metrics such as liquidity depth or slippage, with overall liquidity below 1%, which relates to the fact that the main users of the RWA trading platform are still crypto-native retail investors.
The difference with Hyperliquid is that the trading volume of crude oil contracts on Hyperliquid significantly increases during weekends.This indicates that besides retail investors with speculative demands, traders who want to gain exposure to crude oil trading before Monday and conduct hedging operations are also trading on Hyperliquid. Moreover, this trend is becoming increasingly evident, allowing Hyperliquid to develop price discovery capabilities for commodities.
However, for institutional investors, the high trading costs on the Hyperliquid platform compared to CME remain the main barrier for its expansion in the commodities trading sector. If Hyperliquid does not improve its capabilities to handle institutional-level orders soon, it can only serve as a temporary trading venue for traditional traders on weekends, ultimately becoming a minor supplement in the traditional financial landscape.
Research Methodology and Data Sources
This analysis evaluates the microstructure of the crude oil market through two studies, covering both weekday and weekend markets, utilizing tick trading data from two exchanges: Hyperliquid's xyz:CL perpetual contract and CME's CLJ6 (April 2026 NYMEX WTI crude oil futures).
CME data is sourced from the Databento trading data source, which captures tick transaction data rather than order book snapshots. Therefore, all depth and slippage estimates for CME are based on actual transaction volumes rather than quoted depths. Hyperliquid data is derived from Hyperliquid's publicly available S3 database, which includes complete on-chain transaction records.
Thus, the analysis for both exchanges is based on actual transaction volumes. All depth data represents explicit liquidity, i.e., the trading volume within a specific basis point range at the VWAP midpoint over a five-minute window, rather than the complete resting depth on the order book.
Research Period and Market Context
The research period was from February 27 to March 16, 2026, coinciding with the geopolitical turmoil following Iran's attack on February 28, 2026.
- Market closing before the attack: the last CME trading day before the attack occurred.
- Monday opening: substantial reopening pressure on the market, with CME stock prices gapping significantly higher while the Hyperliquid xyz:CL market was constrained by discovery boundaries.
- Subsequent weekends: with oil prices remaining high, market volatility kept crude oil trading volumes high on the Hyperliquid platform.
xyz:CL launched in early 2026, meaning these three weekends' observations cover the early maturation phase of the Hyperliquid market. The trends observed, including increased liquidity depth, trading volume, and user count, partly reflect the maturation of the market. However, we believe that on-chain exchanges currently cannot match traditional exchanges in absolute metrics such as liquidity depth or slippage.
The goal of our study is to track directional trends: whether the price spread between the two is narrowing, the speed of that narrowing, and under what conditions it is narrowing.
Data Analysis
Data analysis is divided into two parts by time period:
- Weekday period: covering a full three-week period, comparing the depth, slippage, and premiums/discounts of trading between Hyperliquid and CME during weekdays. For Hyperliquid, we also analyzed its financing rates throughout the entire period.
- Weekend period: within the given timeframe, encompassing three weekends, we analyzed price discovery and the price gap deviation of Hyperliquid relative to CME's opening price.
Weekday Period Data Analysis
This analysis covers a full three-week period, focusing on the times when both exchanges are active simultaneously.
Liquidity depth is measured by the dollar trading volume within a ±2, ±3, and ±5 basis point range at the VWAP midpoint within each 5-minute interval, and aggregated as the median for all weekday intervals. As mentioned, this reflects the transaction volume within the interval rather than the resting quote depth. This method may underestimate the liquidity depth of both CME and Hyperliquid.
Execution slippage is estimated using a synthetic order book sorted by executed price. In each 5-minute period, the observed market orders are arranged in ascending order of price (simulating sell orders), and sell orders are executed sequentially until the target order size is reached. The price at which it is reached is set as the lowest executed price during that period (representing the best sale price at the time the order arrived). Slippage is calculated as the difference between the volume-weighted average price (VWAP) and the arrival price, expressed in basis points. This method applies to incremental order sizes from $10,000 to $1,000,000.
The Hypeliquid-CME basis during weekday periods tracks the signed price difference between the Hyperliquid midpoint and the CME latest price within 5-minute windows across all weekday periods. This reflects any structural premium or discount of Hyperliquid relative to CME's reference price during active periods. Hyperliquid midpoint prices are derived from the volume-weighted average price (VWAP) from trades executed in each 5-minute trading period, rather than real-time order book quotes.
Hyperliquid financing rates are billed on an hourly basis, with financing rates expressed in basis points per hour.
Weekend Period Data Analysis
This analysis focuses on three different weekend closure periods of CME:
- W1: February 28 to March 1, 2026
- W2: March 7 to March 8, 2026
- W3: March 14 to March 15, 2026
In W1 and W2, Hyperliquid's perpetual contract was constrained, thus the marked price could not exceed the "boundary limits" (DB). When the oracle price freezes (for example, when the major reference market (CME) is closed and external price data sources stop updating), the protocol effectively restricts the price to a narrow range.
For each weekend window, we report key metrics for Hyperliquid xyz:CL, including price, volume, and transaction count. To measure the deviation of the Monday opening price gap, for each weekend, we will measure the price gap between Hyperliquid and CME at three reference points:
- 3 hours before CME reopening
- 1 hour before CME reopening
- At CME opening (T=0)
All price differences are expressed in basis points, with positive values indicating that Hyperliquid is above CME's opening price, and negative values indicating a discount.
Quantitative Analysis
This section begins with an analysis comparing the liquidity状况 of Hyperliquid xyz:CL HIP-3 crude oil market with NYMEX CLJ6 during the overlapping periods on weekdays.
Liquidity Depth: Hyperliquid is Less Than 1% of CME
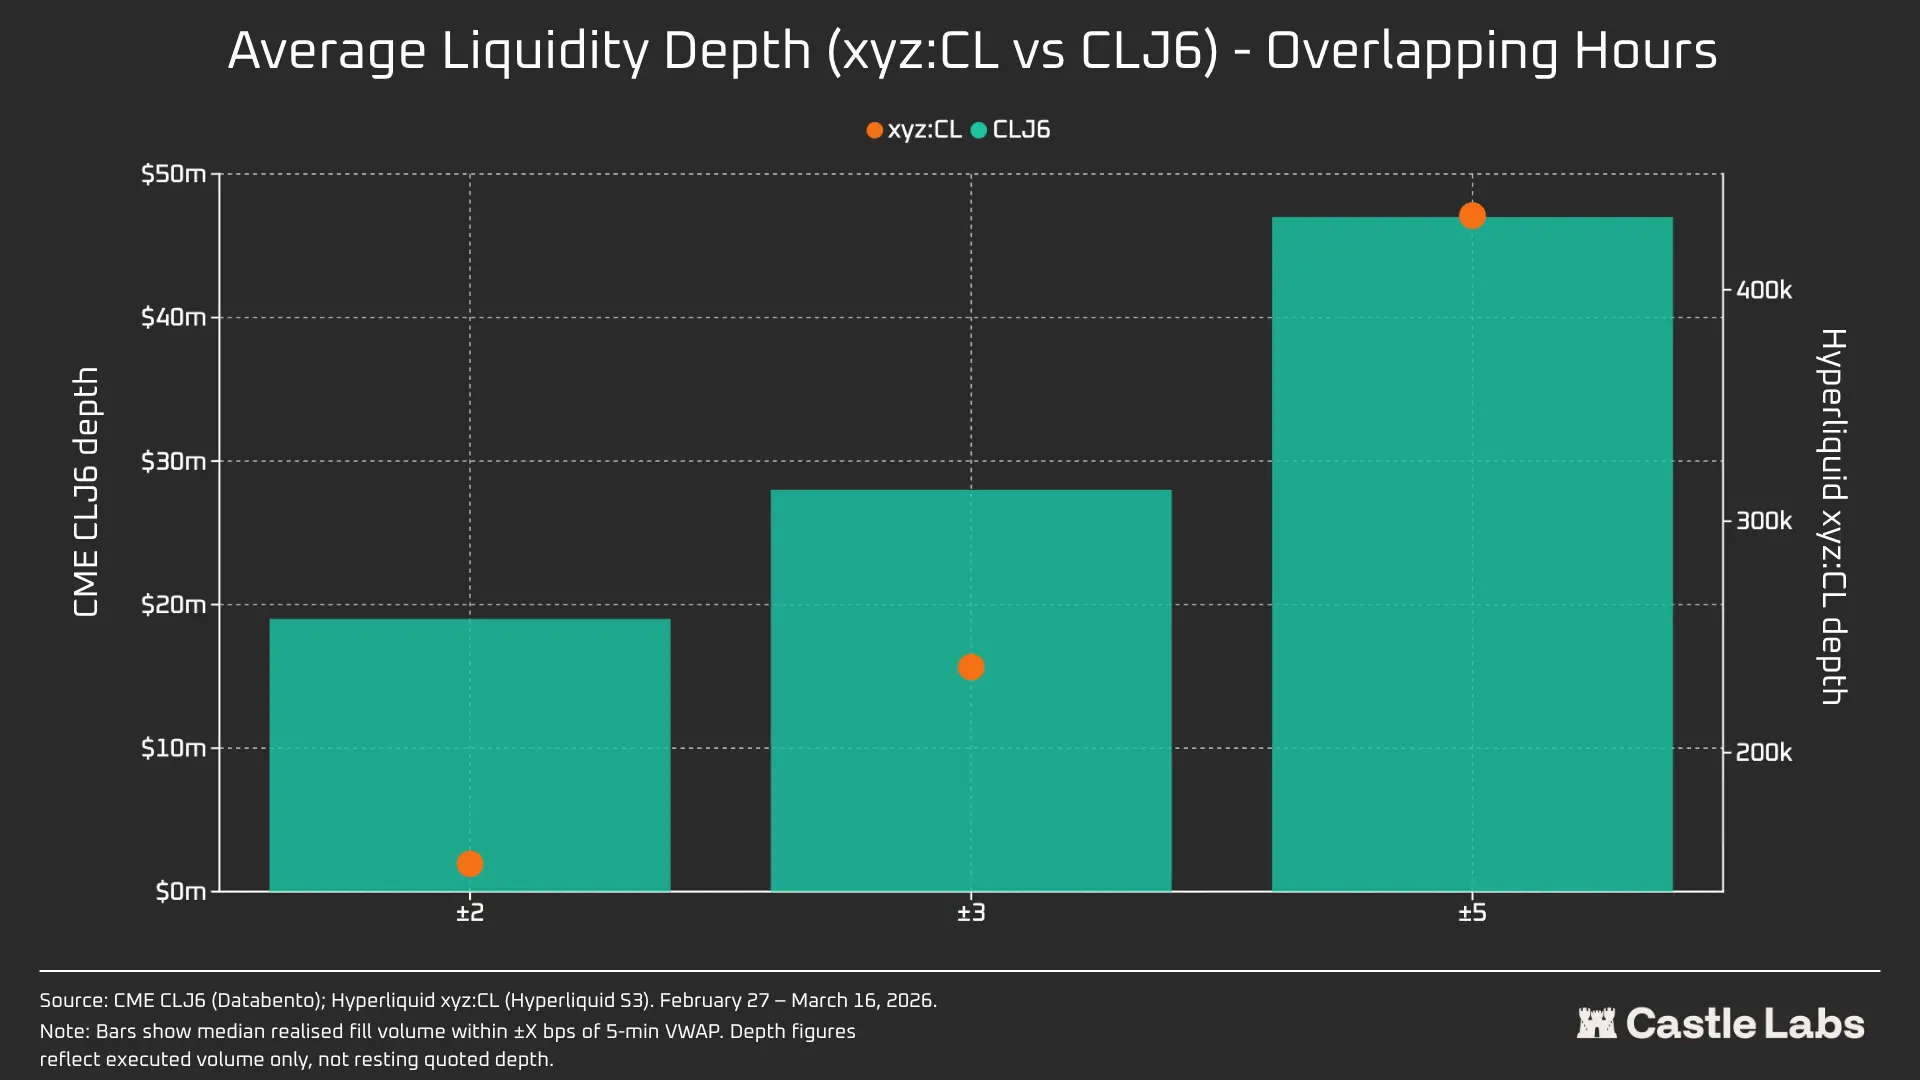
There is no doubt that the liquidity situation of on-chain exchanges is starkly different from that of CME. The average liquidity depth of CL on Hyperliquid is less than 1% of CLJ6, with consistent liquidity depths across price ranges (109 times at ±5 bps). Within the ±2 bps interval, CME's executable depth is $19 million, while Hyperliquid's is only $152,000, a difference of 125 times.
Considering the novelty of the CL market on Hyperliquid and the different target user groups, this result is not surprising. The main value of on-chain exchanges lies in providing non-permissioned trading channels for those traditionally excluded from institutions like CME.
However, as weekend trading volumes on DEX platforms like Hyperliquid increase, the perception of these platforms is beginning to shift, with institutional investors increasingly interested in hedging positions during non-trading periods, making it increasingly important for Hyperliquid to create a market environment suitable for traditional investors and retail traders.
For retail traders with a trading volume of $10,000, this cost gap is negligible. But for institutional investors with a trading volume exceeding $1 million, the on-chain trading costs for CL (and most other markets) remain unbearable.
In fact, the inherent differences in user groups are reflected in the median transaction sizes during these overlapping market periods.
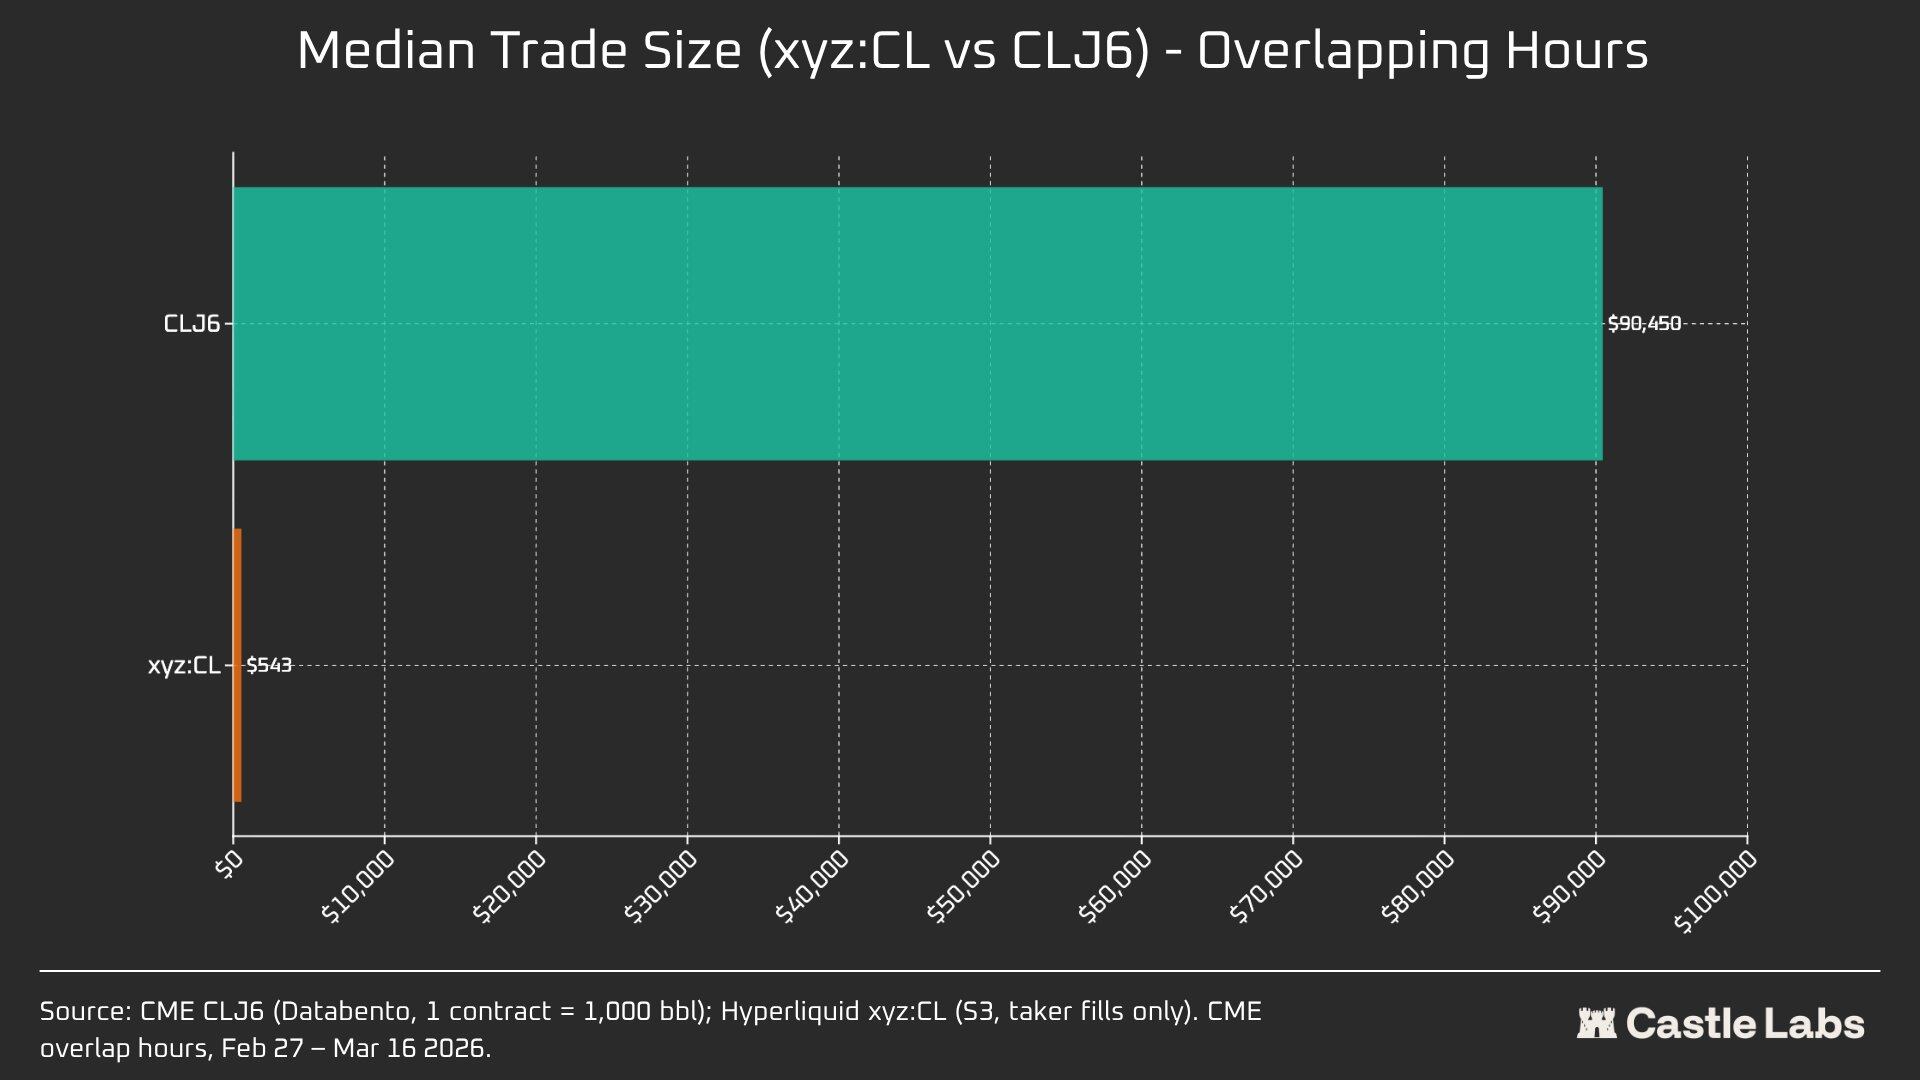
The 166 times difference in median transaction size (90,450 USD vs 543 USD) clearly demonstrates the fundamental difference in the user groups served by these exchanges. The median transaction size of CLJ6 is comparable to a standard crude oil futures contract (with a nominal value of approximately $94,000 at current prices), while Hyperliquid's median transaction size is 543 USD, reflecting the situation of crypto-native retail traders making leveraged directional bets.
We expect that as these markets become increasingly legitimized in the eyes of more traditional investors and funds move on-chain, the median transaction size in the Hyperliquid commodity market will reach a tipping point.
To further differentiate transaction sizes, we conducted order simulations with order size limits ranging from $10,000 to $1,000,000.
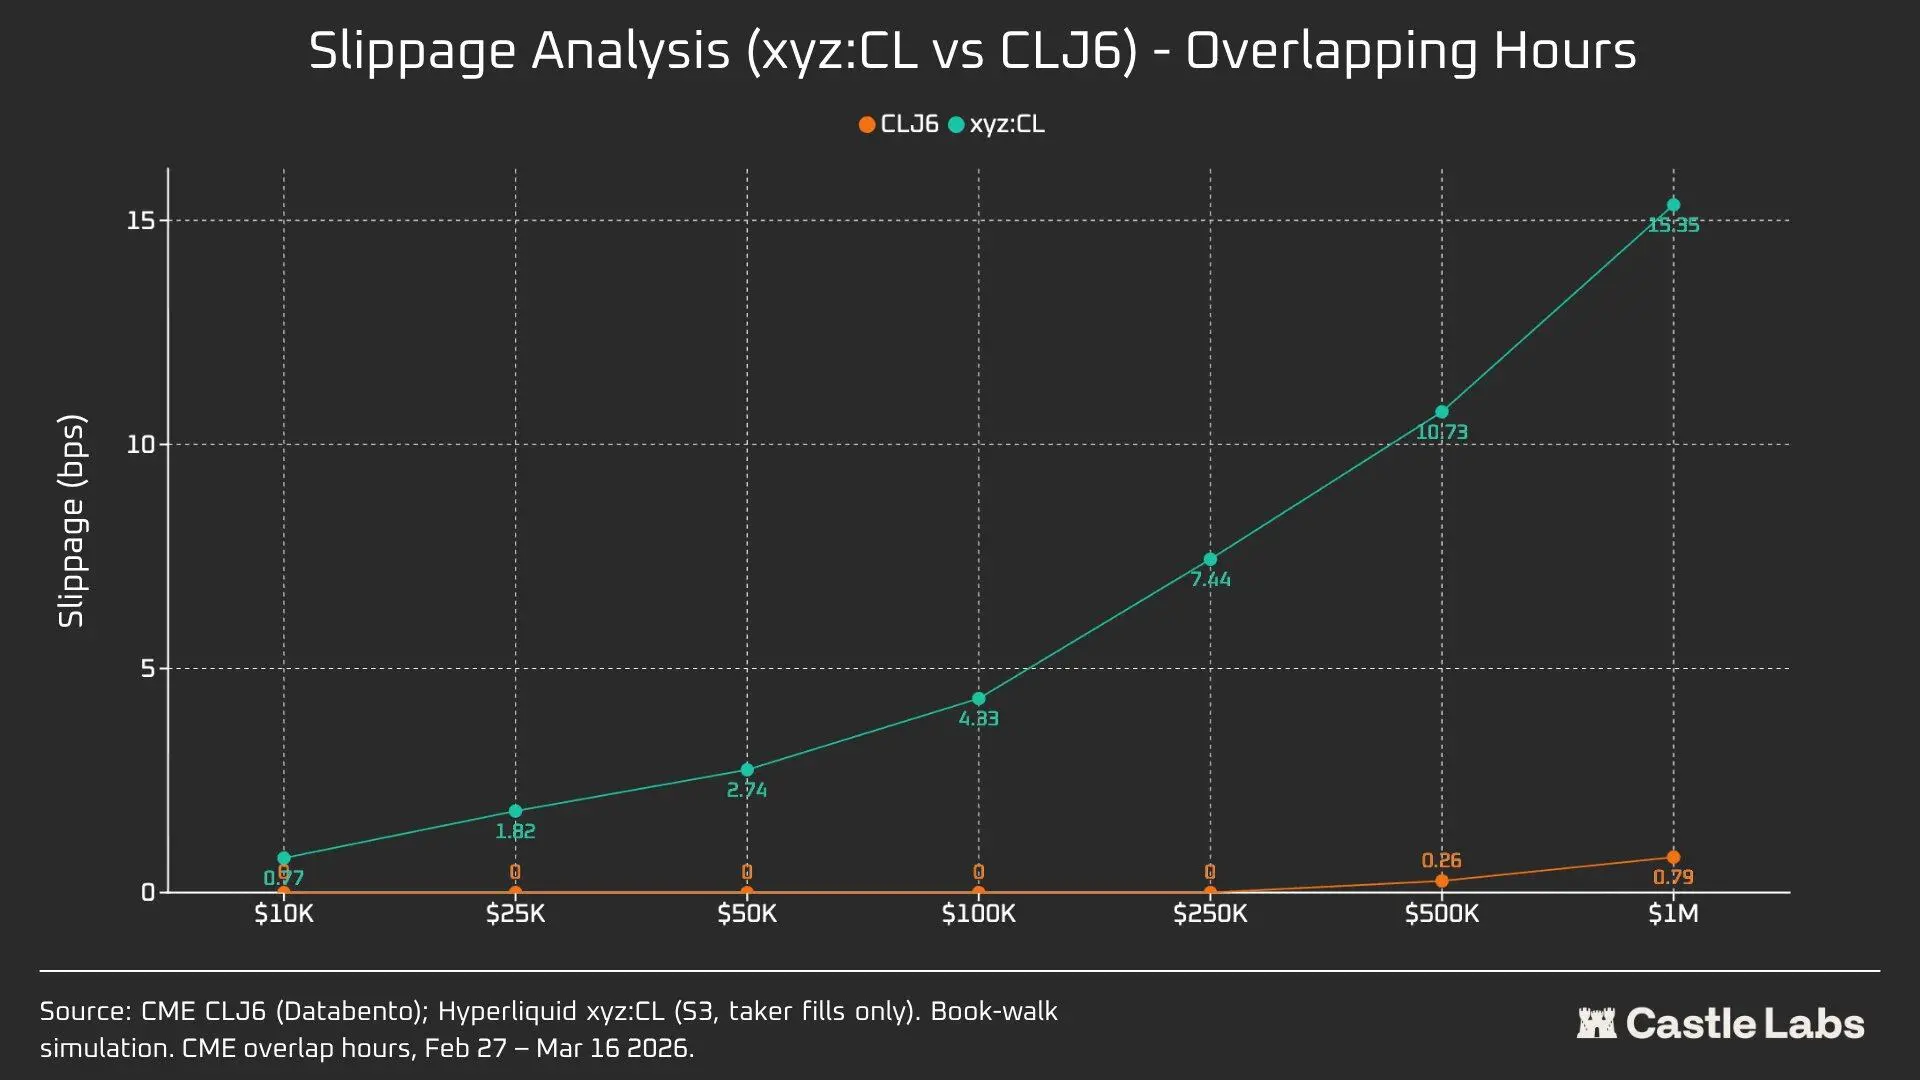
For a $10,000 order, CLJ6 traders experience no slippage, which is as expected, while Hyperliquid users have a median execution slippage of less than 1 basis point, at 0.77 basis points. The gap emerges at $100,000 orders, at which point Hyperliquid users' slippage rises to 4.33 basis points, nearing the 5 basis points threshold, while CME CLJ6 experiences no slippage.
Notably, this exceeds the median transaction size of the CLJ6 market (90,450 USD).
At a $1 million transaction size, Hyperliquid's 15.4 basis points is about 20 times CME's 0.79 basis points, confirming that this trading venue currently lacks the capacity to handle institutional-level orders. Given Hyperliquid's average transaction size, the platform is fully capable of providing the same quality of service to users without incurring slippage.
CLJ6 orders only start to experience significant slippage at around a $500,000 transaction size, affecting their execution.
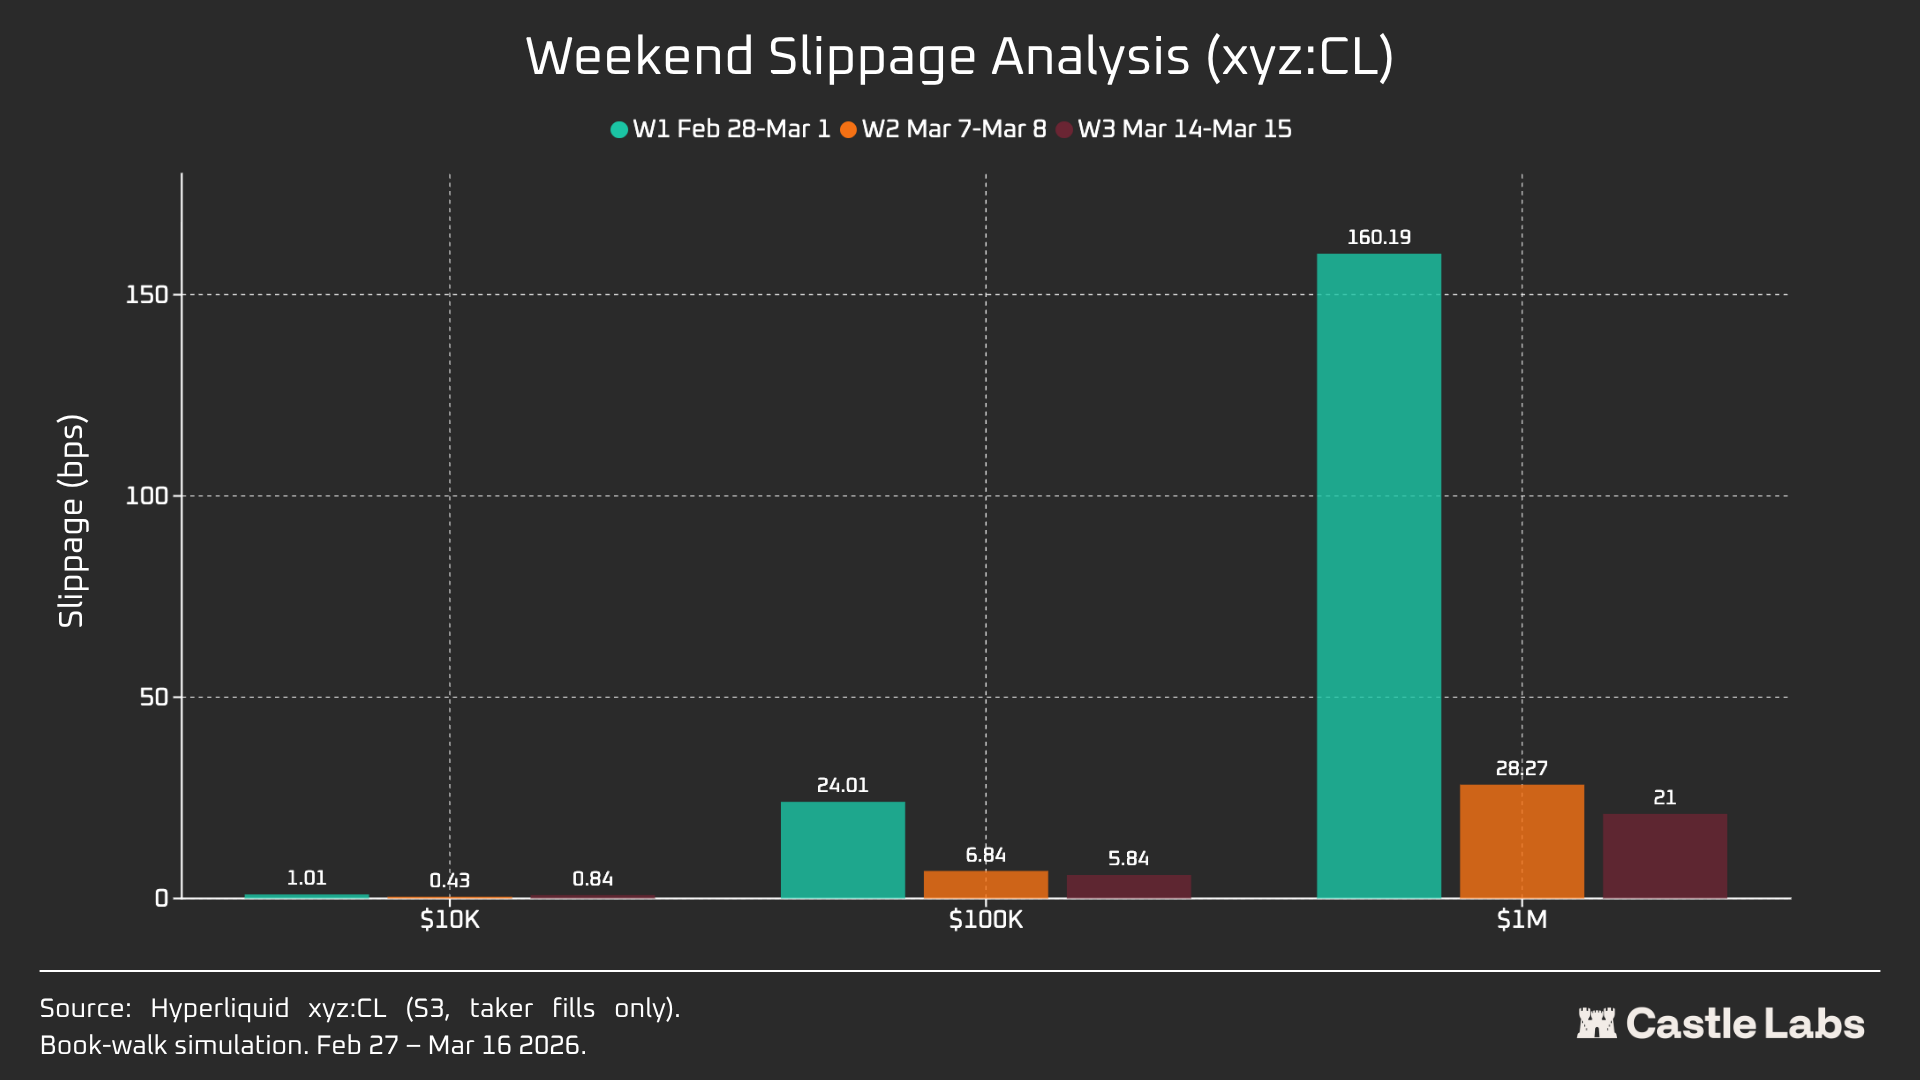
When we extend the order size analysis to weekends, slippage for all order sizes decreases, especially for $100,000 and $1,000,000 order sizes, indicating market maturation. Over the three weeks analyzed, the slippage reduction of simulated orders is as follows:
- $10,000: -16%
- $100,000: -75%
- $1,000,000: -86.9%
Financing Rates
The financing rates for CL fluctuate significantly during CME closing periods, but fluctuate less during settling periods. This helps reveal the internal pricing dynamics of the market during non-trading periods. Weekend openings mean that the CL market can utilize internal price discovery mechanisms (supported by DB and other risk-reducing mechanisms). Therefore, financing rates are expected to be more volatile, as highlighted below.
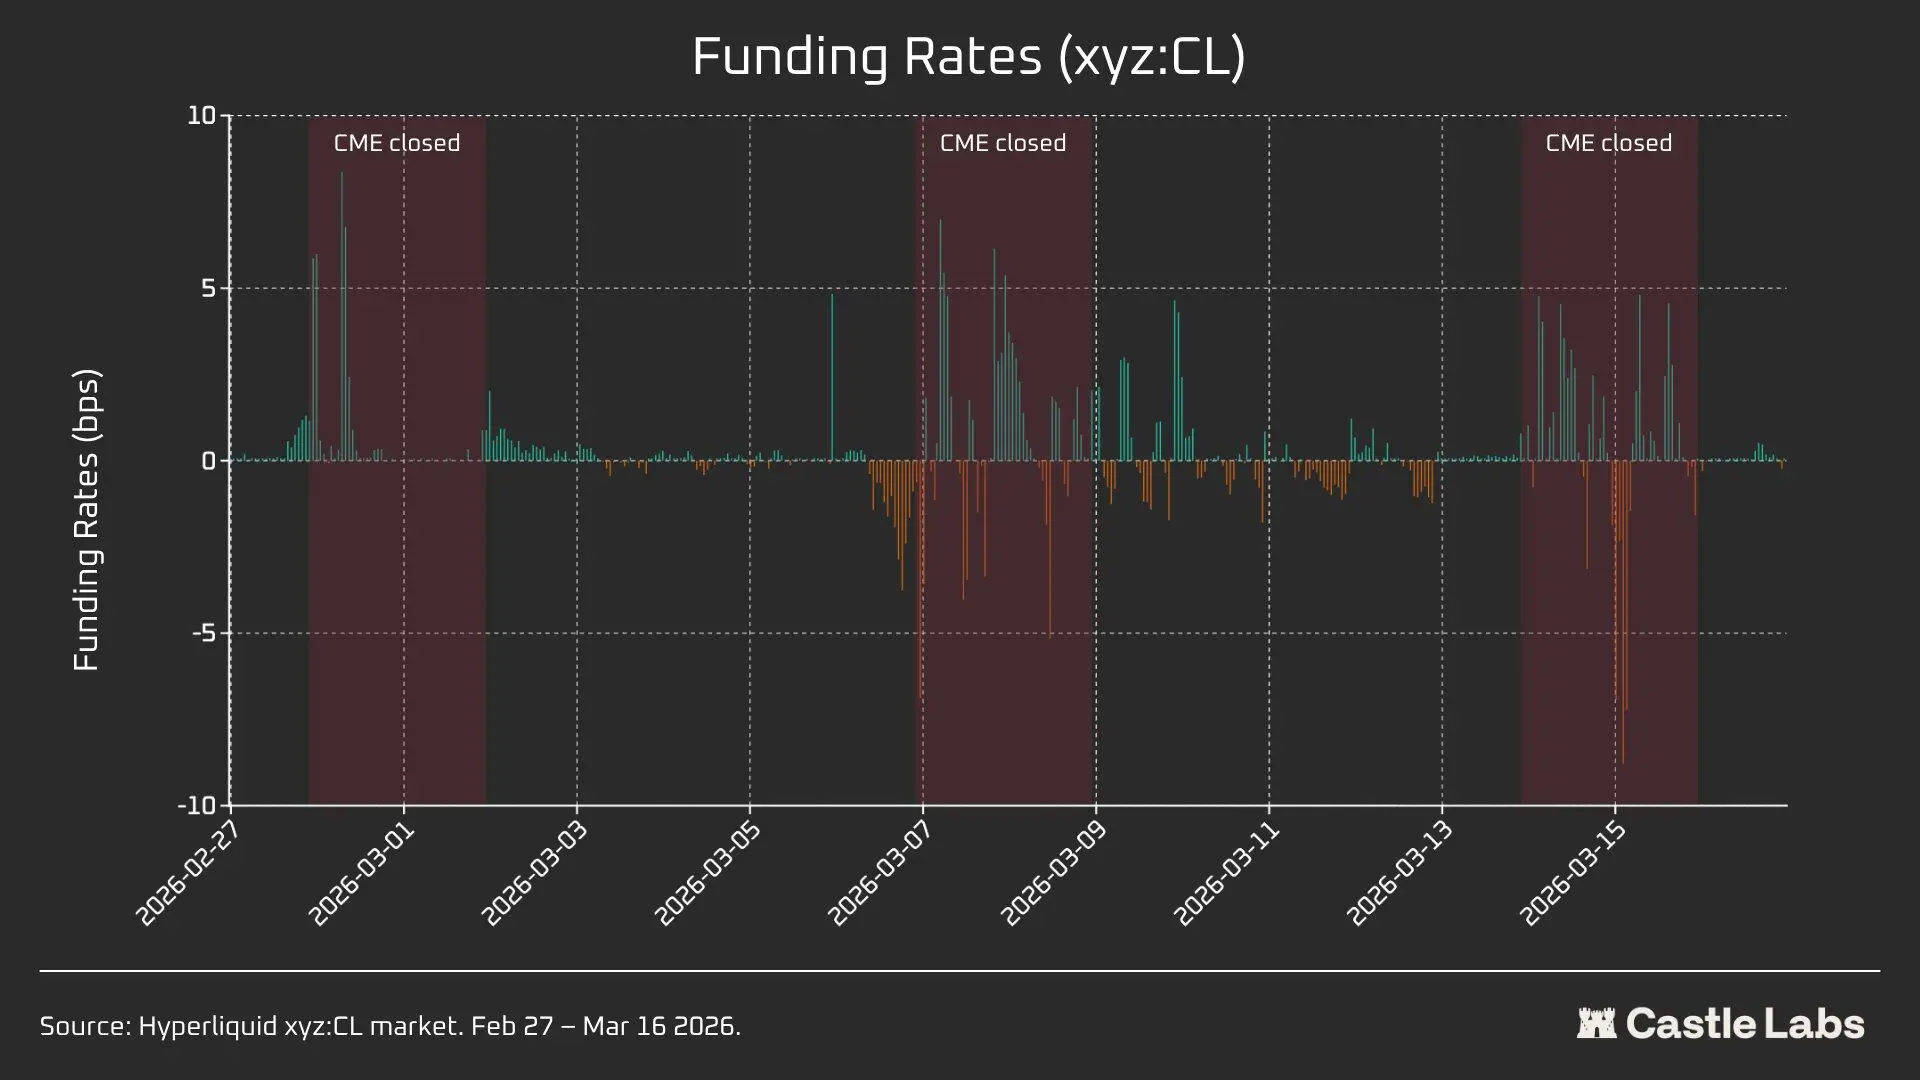
During active trading periods, Hyperliquid's xyz:CL closely follows the price trends of CME's CLJ6; however, as oil prices rise, a structural discount appears and expands, possibly due to the financing rate pressure from accumulated long positions. During the weekend, with CME closed, Hyperliquid's price discovery is further constrained by the price range mechanism (DB), which limits the fluctuation of the marked price in the absence of a real-time reference market.
Weekend Analysis: Hyperliquid Has Acquired Price Discovery Capability
These three weekends showcase the rapid maturation process of the Hyperliquid market:
W1: February 28 to March 1, 2026 (Iran Attack Incident)
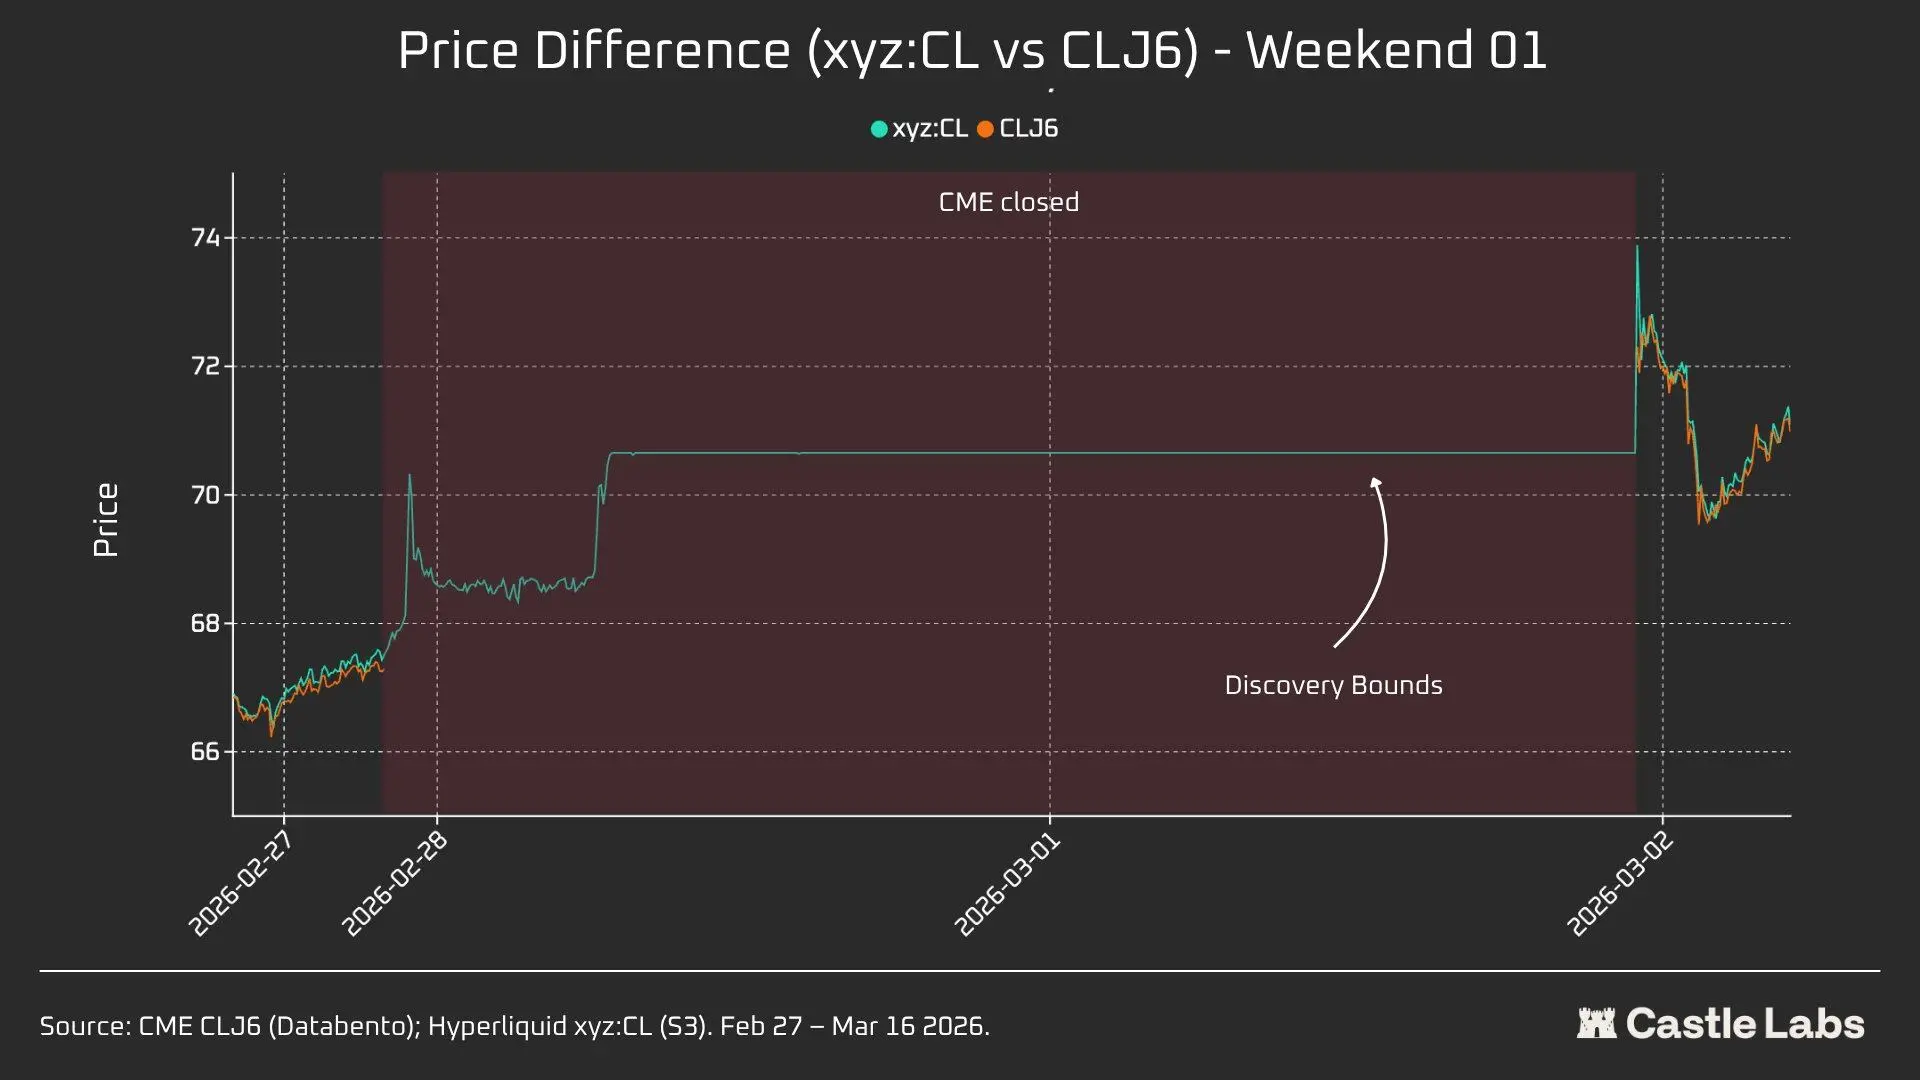
The price on Hyperliquid rose from close to $67.29 at CME to about $70.80, accounting for approximately 45% of the final jump to $75 on Monday (+1146 basis points).
It is particularly noteworthy that the price discovery of this weekend was constrained due to the ±5% price boundary limit mechanism (DB) mentioned above. This explains the relatively smooth curve in the chart and why there was a gap opening on Monday. Nevertheless, in the first second after the paired data was published, the gap between Hyperliquid xyz:CL ($73.89) and CME CLJ6 ($75) was within 1.5%...
免责声明:本文章仅代表作者个人观点,不代表本平台的立场和观点。本文章仅供信息分享,不构成对任何人的任何投资建议。用户与作者之间的任何争议,与本平台无关。如网页中刊载的文章或图片涉及侵权,请提供相关的权利证明和身份证明发送邮件到support@aicoin.com,本平台相关工作人员将会进行核查。


