Coin Wave Riding: April 7 Bitcoin (BTC) Market Analysis Reference:
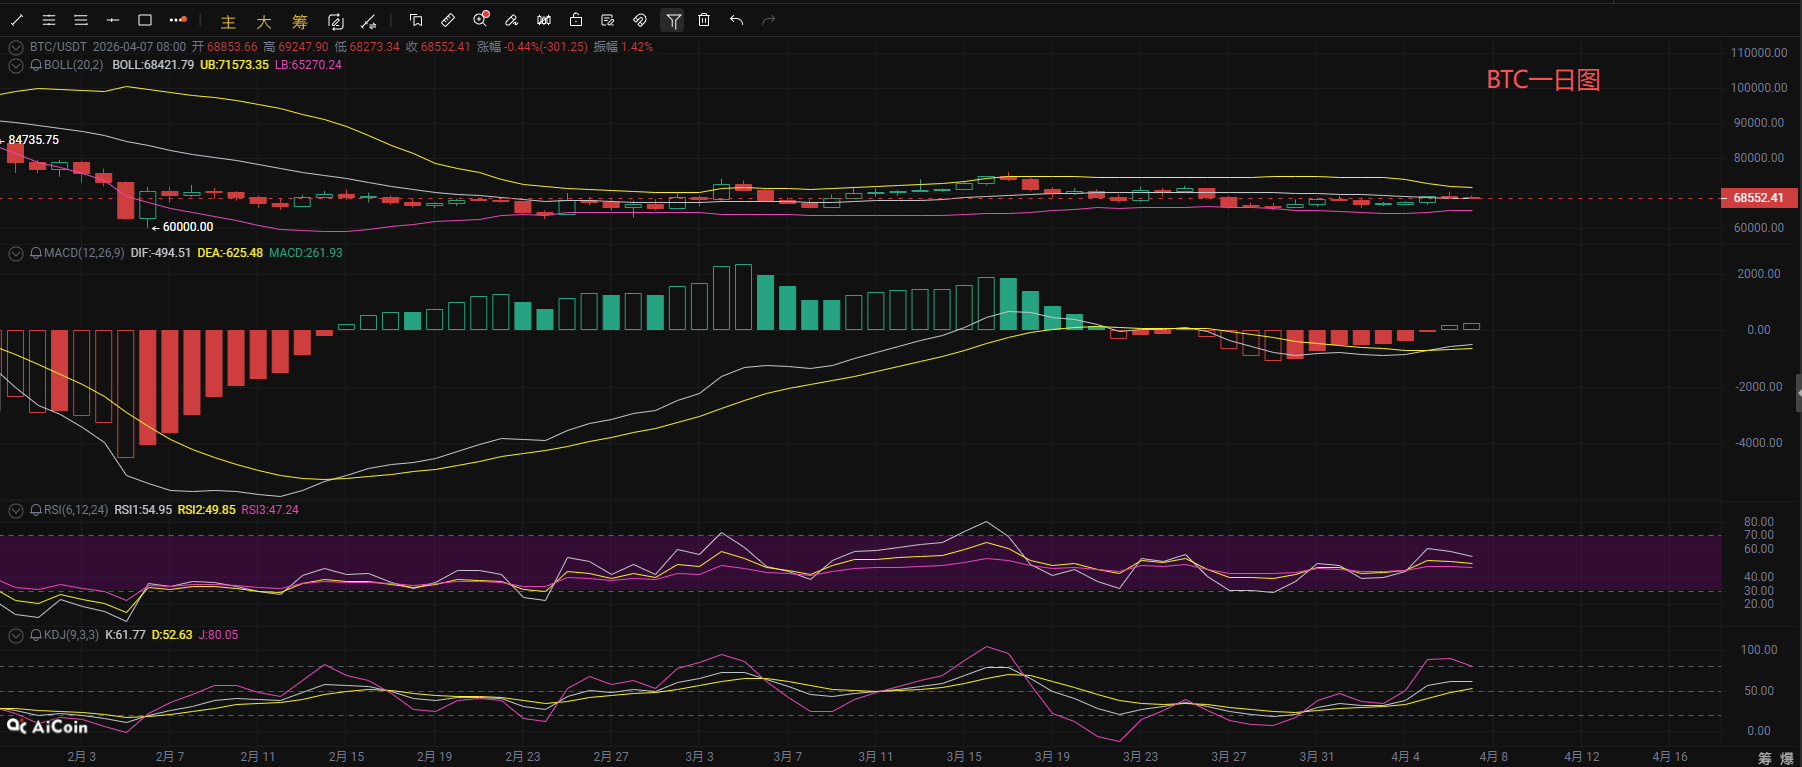
Yesterday, Bitcoin oscillated upward and broke through the 70,000 mark, but the bulls failed to maintain their upward momentum, and the price subsequently came under pressure and adjusted. On the daily level, the K-line has produced three consecutive spinning top candles, the Bollinger Bands have continued to narrow and flatten, with the price operating above the mid-track. Overall, it maintains a range oscillation pattern, with the upper resistance at 71,600. In terms of indicators, the MACD double line is golden cross upward below the zero axis, and the histogram is gradually expanding, showing that bearish momentum is gradually releasing while bullish strength continues to accumulate, mid-term rebound momentum has strengthened; the RSI three lines are moving upward simultaneously and have broken through the 50 neutral line, bullish sentiment is warming up, and the price has entered a strong oscillation range without entering the overbought area, leaving room for further upward movement; however, in the KDJ indicator, the J line has entered the overbought area, indicating a technical adjustment is needed in the short term. Overall, BTC shows a strong oscillation pattern on the daily line with the bulls dominating, and the mid-term rebound structure remains intact. For future operations, the lower Bollinger Band mid-track at 68,400 serves as a key short-term support, and the upper crucial focus is on the 71,600 pressure area. A successful breakout may open further upward space.
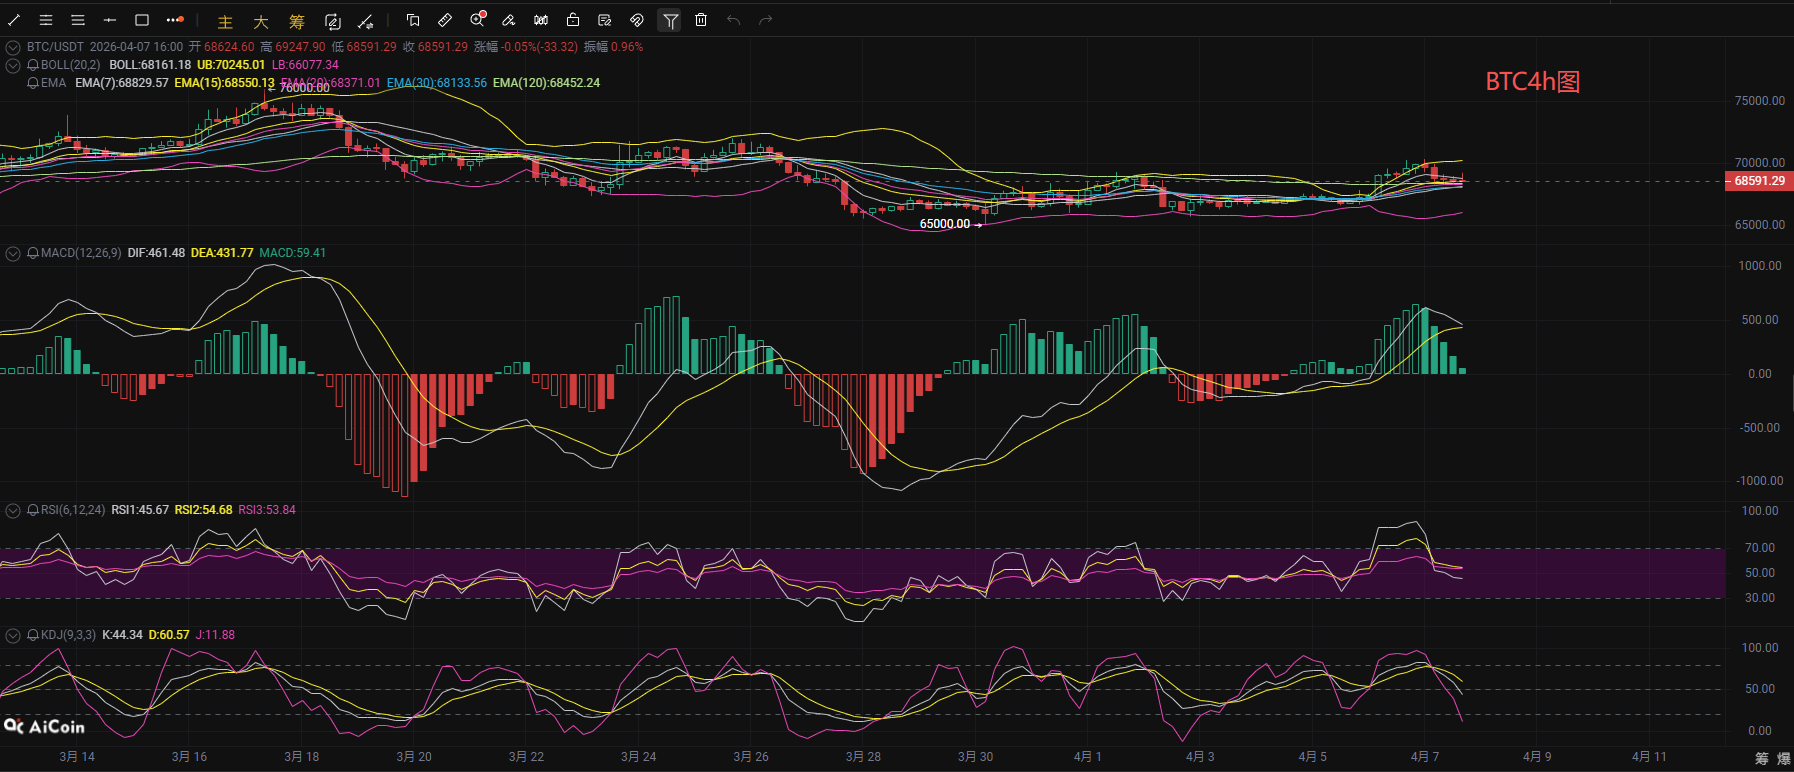
From the short-cycle hourly chart perspective, the 4-hour EMA moving averages maintain a complete bullish arrangement, and the price is firmly above the short-term moving average, relying on the EMA 30 to form strong support. The Bollinger Bands have opened upwards following the price surge, and the lower track is constantly lifted, with the price stabilizing above the mid-track. Currently, it may be a short-term oscillation adjustment, and the overall upward trend remains intact. The MACD double line operates above the zero axis, but the histogram continues to contract, indicating a slowdown in bullish upward momentum; the RSI three lines have fallen back to the neutral zone of 50, and have not entered the overbought area; while the KDJ three lines have formed a dead cross downward, and the J line has entered the oversold area, confirming the short-term existence of technical adjustment demand. In summary, BTC at the 4-hour level is in a high oscillation phase within an upward trend, the mid-term bullish structure remains intact, while the short-term is mainly focused on readjustment and consolidation. The first pressure level above focuses on the 70,000-70,300 range (previous highs combined with the upper Bollinger Band), while strong support below is located around 68,200 near the EMA 30 and the Bollinger Band mid-track. It is advised to buy on dips to support levels for a more prudent approach.
Coin Wave Riding: April 7 Bitcoin Short-term Reference:
Long Position: Buy in the range of 67,500-68,300, stop loss 500 points, target 69,000-70,000,
Short Position: Sell in the range of 69,500-70,500, stop loss 500 points, target 68,500-67,500,
Coin Wave Riding: April 7 Ethereum (ETH) Market Analysis Reference:
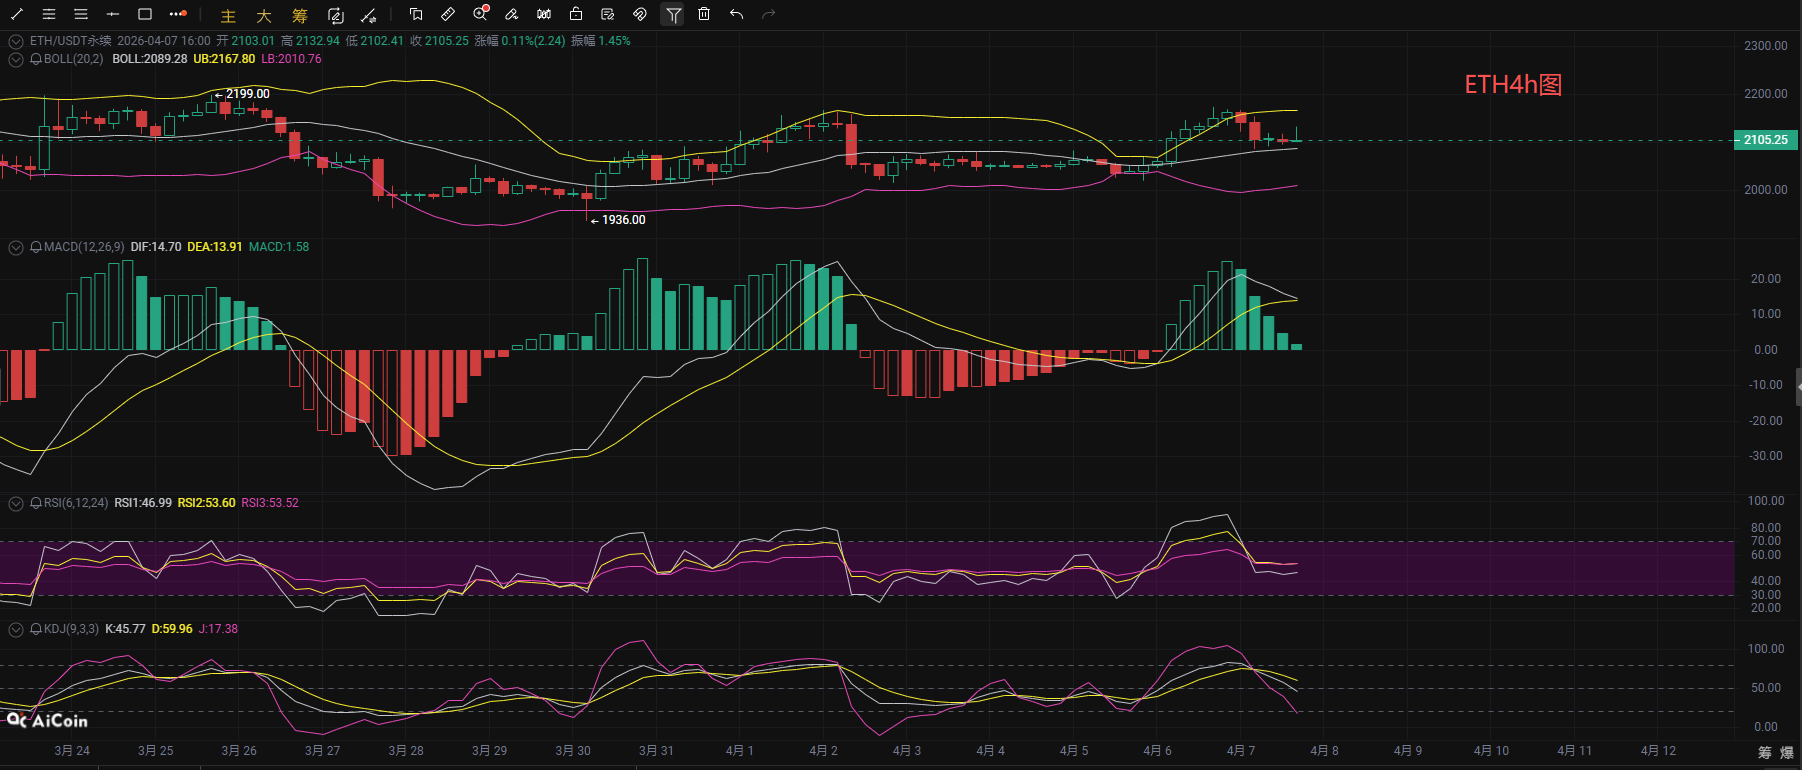
From the dual-period technical aspects of Ethereum on the 4-hour and 1-hour charts, the 4-hour price has surged and retraced, operating between the middle and upper tracks of the Bollinger Bands, where the upper track pressure is quite evident; the MACD histogram is gradually shrinking, and the DIF at high positions shows signs of forming a dead cross, while both RSI and KDJ are retreating from high positions, indicating a significant depletion of bullish momentum and insufficient continuity for an upward trend. At the 1-hour level, the price has fallen below the mid-track of the Bollinger Bands, the MACD double lines have crossed below the zero axis, and the KDJ and RSI are both turning downward from high positions, with short-term bearish momentum continuing to release and pressure on the adjustment increasing. Considering the resonance of multiple period indicators, ETH is likely to oscillate and retract in the short term, first testing the support at the lower range of 2,080-2,100. If it breaks below 2,080, it may further probe the 2,050-2,060 region; if the support holds, it is expected to stabilize and return to an oscillation rebound trend. In terms of operations, it is advised to buy on dips at lower positions.
Coin Wave Riding: April 7 Ethereum Short-term Reference:
Short Position: Sell in the range of 2,000-2,160, stop loss 30 points, target 2,120-2,060,
Long Position: Buy in the range of 2,050-2,090, stop loss 30 points, target 2,100-2,170,
[The above analysis and strategies are for reference only. Please bear the risks yourself. The article review and publication may have delays, and the strategies may not have timeliness; do not operate blindly]

This article is originally shared by 【Coin Wave Riding】 and represents only personal opinions. There may be delays in article sending, and it is for reference only. Do not operate blindly! Want to get more daily real-time trades? Then follow my public account. Here, you can engage in online technical learning of the market and learn about knowledge related to unwinding positions. I have years of research experience in the market, focusing on the overall trend of the cryptocurrency circle. Mainly responsible for analyzing and guiding investment operations of BTC, ETH, SOL, BCH, and other currencies. Welcome to study and research together.
免责声明:本文章仅代表作者个人观点,不代表本平台的立场和观点。本文章仅供信息分享,不构成对任何人的任何投资建议。用户与作者之间的任何争议,与本平台无关。如网页中刊载的文章或图片涉及侵权,请提供相关的权利证明和身份证明发送邮件到support@aicoin.com,本平台相关工作人员将会进行核查。