Coin Circle Academician: On April 11, Ethereum moved from bottoming out to rising, Ethereum 2248 opens a new cycle, a moment for trend traders to profit! Latest market analysis reference
Ethereum's current price is 2250. Have the low buy strategies for Ethereum in recent days brought you profit? Stop listening to those panic remarks about waterfall collapse! From 1736 to the current 2247, this rebound has long provided ample signals, yet many are still hesitating to step in. Today, let's delve into the current market using daily and four-hour dual timelines, without making grand predictions, but instead providing actionable judgments and operational references that you can implement right after reading! To be honest, making profits with this low buy strategy relies not on luck but on following the trend. Don’t get distracted by short-term fluctuations; the low buy strategy has been validated for so long, so it’s time to stop unnecessary tussling. Earning steadily by following the trend is better than anything else.
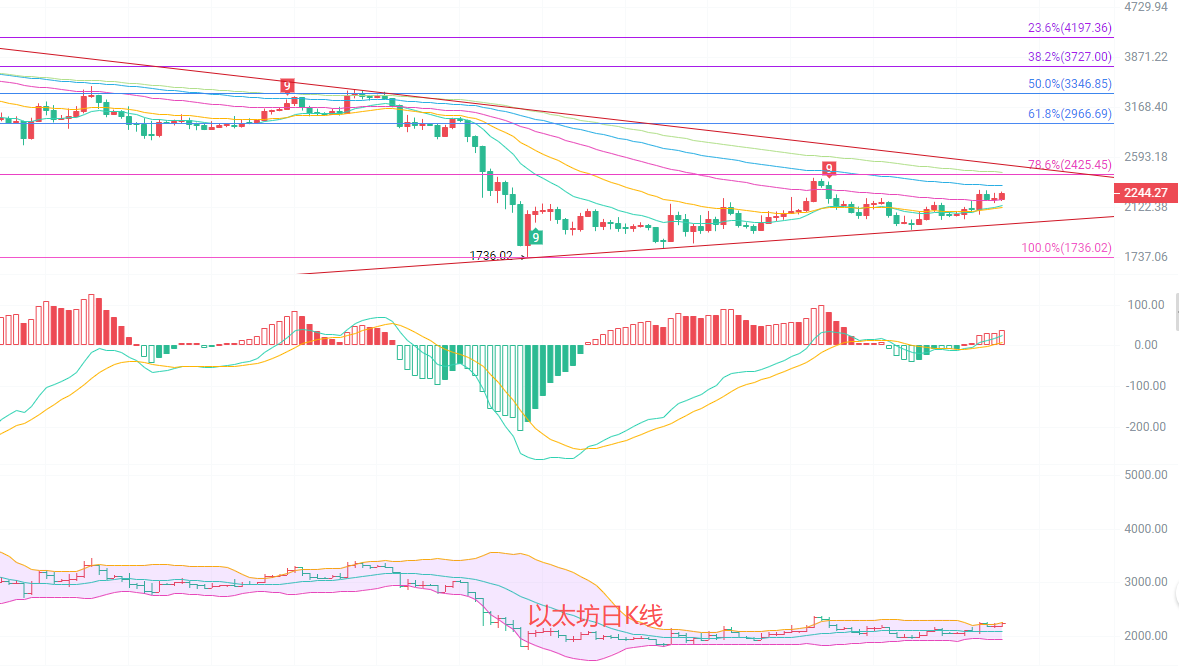
The daily chart shows a preliminary formation of a short-term upward arrangement. The MACD indicator has crossed above and continues to rise, the red bars are noticeably expanding, and upward momentum is being released; the middle track of the Bollinger Bands has shifted from resistance to support, and the price is running above the middle track, indicating a shift from a downward trend to a consolidation rebound channel. However, there is resistance near the upper Bollinger Band at around 2258, and the EMA120 moving average is still in a downward trend, meaning the medium to long-term downward trend has not completely reversed; a breakthrough past 2300 is needed to confirm continuation.
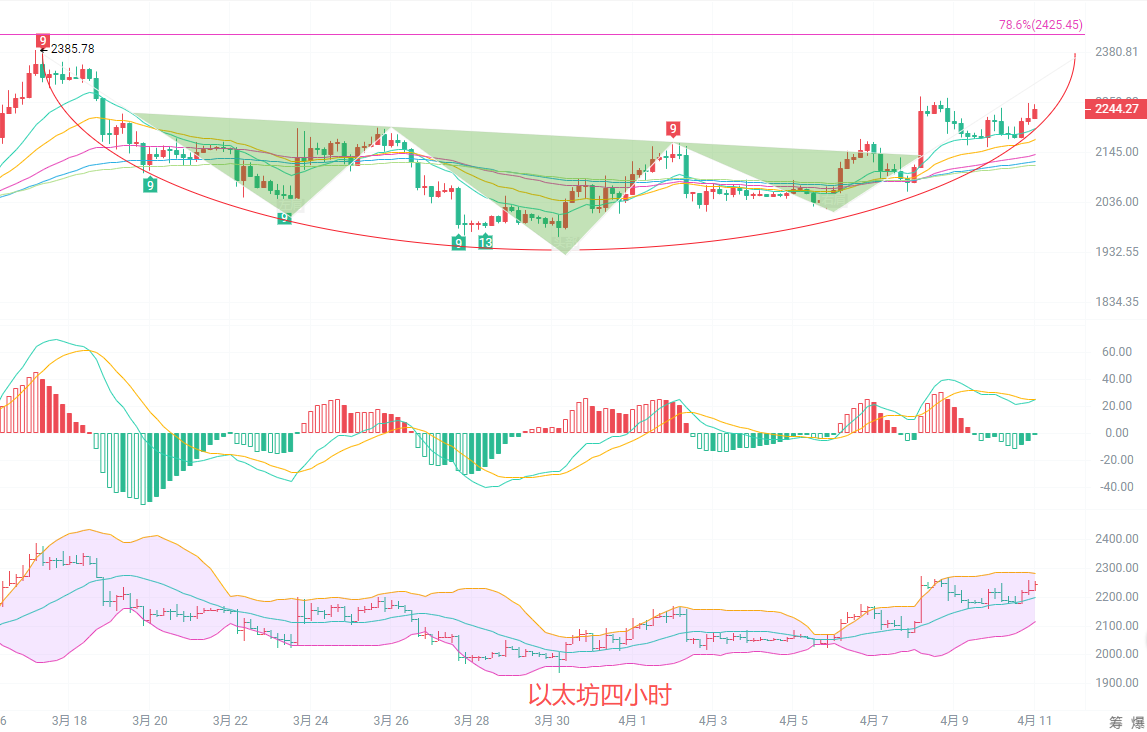
On the four-hour chart, the price is running along the upper track of the Bollinger Bands, currently stabilizing above all EMA moving averages, indicating a clear short-term upward trend. The MACD operates above the zero axis; although the red bars have slightly shortened, the DIF and DEA still maintain a golden cross state, with no signs of reversal; the Bollinger Bands are widening upwards, with short-term pressure near the upper band at 2284, and strong support at the middle band of 2199. Recently, the price has been repeatedly oscillating in the range of 2200-2250, and though the upward momentum has somewhat weakened, the magnitude of the pullback is limited, reflecting a healthy consolidation during the upward process.
Short-term reference: (Actual trading data has been updated; please consult the author for details)
Buy from 2220 to 2210, stop loss at 2180, aim for 2270 to 2280; if broken, target 2320
Sell from 2280 to 2300, stop loss at 2330, aim for 2250 to 2220 (be cautious with shorts)
Specific operations should be based on real-time market data. For more information, please consult the author. The publication of the article may be delayed, and it is advised for reference only, with risks borne by yourself.

Friendly reminder: The above content is solely created by the author of the public account. Any ads at the end of the article or in the comments section are unrelated to the author; please discern carefully. Thank you for reading.
免责声明:本文章仅代表作者个人观点,不代表本平台的立场和观点。本文章仅供信息分享,不构成对任何人的任何投资建议。用户与作者之间的任何争议,与本平台无关。如网页中刊载的文章或图片涉及侵权,请提供相关的权利证明和身份证明发送邮件到support@aicoin.com,本平台相关工作人员将会进行核查。