Crypto Circle Academician: On April 14, Bitcoin breaking 73800 will open up upward space! It is essential to be clear about key support and resistance! Latest market analysis and reference suggestion interpretation
Bitcoin's current price is 72250, rebounding from a low of 59800, standing above the 72000 mark. The technical aspect has completely exited the downward channel, and the upward trend has officially begun! The current oscillation consolidation is merely a buildup before the rise; understand the structure, seize this intermediate trend, and don't get left behind by the market! Patience is now the greatest test. Many people are always trying to predict the direction, resulting in either chasing highs or catching lows, ultimately getting slapped in the face from both sides. In fact, it is better to wait for the market to reveal itself before acting; if it breaks through, follow the trend, and if it drops, short it. Even if you earn a little less, it’s better than repeatedly stopping losses in oscillation. The essence of trading is to act on certain trends, not to gamble on uncertain directions.
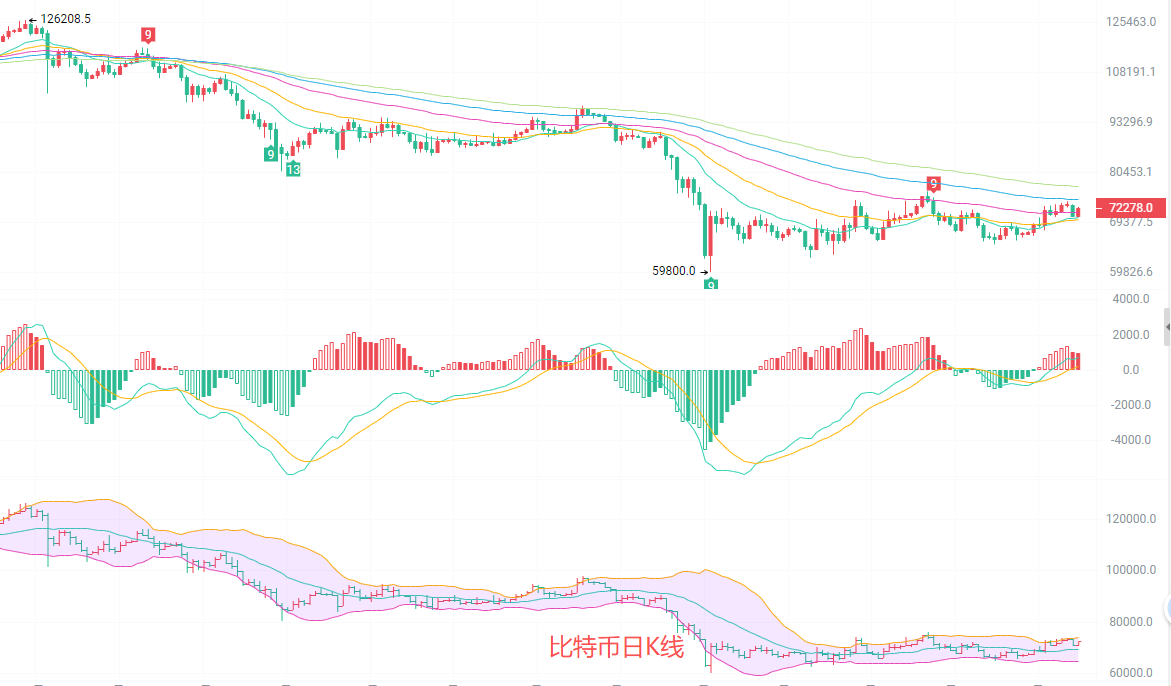
The daily K-line oscillates and builds momentum at the 72000 mark, intensifying the bullish and bearish contest. The moving average system maintains an upward arrangement, with EMA15 and EMA30 forming support, and prices operating near the middle track of the Bollinger Bands. The MACD indicator shows a slight narrowing of the red bars, with upward momentum slowing down, indicating a short-term need for consolidation. The upper track of the Bollinger Band at 73892 is strong resistance, the lower track at 64520 is support, and the 71000 mark acts as a defensive line for upward movement; as long as it does not break, the upward trend will continue.
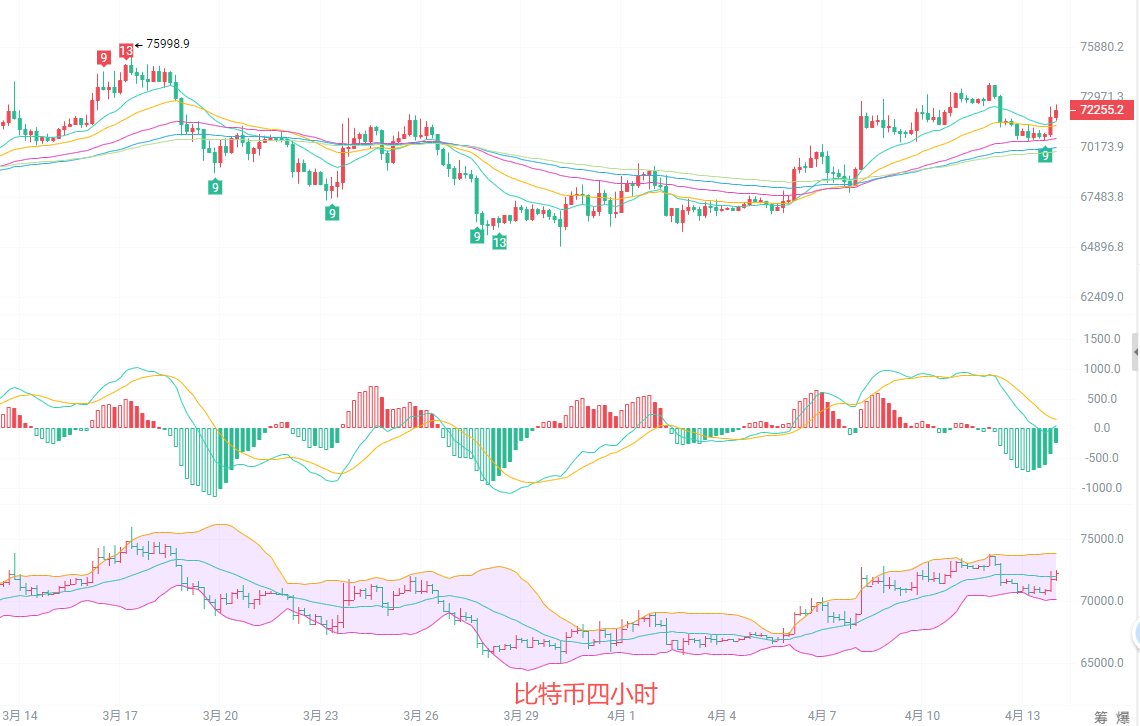
The four-hour K-line is suppressed by the upper track of the Bollinger Bands, causing short-term upward momentum to slow down. Although the upward arrangement of moving averages remains intact, the divergence between price and moving averages is increasing, indicating a need for a pullback to repair. The MACD indicator's red bars continue to narrow, with short-term adjustment signals appearing. The support level is around 71500, with resistance at 72800. The price is testing repeatedly within the range, with a directional choice window emerging, but the upward channel has already appeared. As long as the critical support holds, the upward movement can continue to benefit.
Short-term strategy reference: Follow the trend of the larger cycle, with small stop losses for quick entries and exits.
For upward movement from 71000 to 71500, stop loss at 70500, target looking at 72500 to 72500.
For downward movement from 72500 to 73000, stop loss at 73300, target looking at 72000 to 71500.
In the crypto circle, it is always the foreseeing ones who benefit first, the latecomers who get the scraps, and the oblivious ones who take the losses.
Specific operations should follow real-time market data; for more detailed information, please consult the author. There may be a delay in article publication; suggestions are for reference only, and risks are to be borne by individuals.

Friendly reminder: The above content solely belongs to the author's public account. Advertisements at the end of the article and in the comments section are unrelated to the author, so please discern carefully. Thank you for reading.
免责声明:本文章仅代表作者个人观点,不代表本平台的立场和观点。本文章仅供信息分享,不构成对任何人的任何投资建议。用户与作者之间的任何争议,与本平台无关。如网页中刊载的文章或图片涉及侵权,请提供相关的权利证明和身份证明发送邮件到support@aicoin.com,本平台相关工作人员将会进行核查。