Cryptocurrency Scholar: On April 14, Bitcoin surged in the afternoon to test resistance, how to respond above 74500? Latest market analysis
During this wave of Bitcoin hitting 74500, how many people were frantically staring at their screens? Some chased the high and were thrown off the train, while we held onto the trend and made a profit. There are also friends in the crypto community who panicked in the pullback because they didn't set stop losses. In fact, the crypto world is not about gambling or chasing news, but about following the trend, maintaining rhythm, and ensuring good risk control. Never paint a rosy picture, in the afternoon, use the two-hour and fifteen-minute joint signals to clarify the current trend, key support, and entry opportunities. Newbies can directly reference this; after reading, you will know how to respond next.
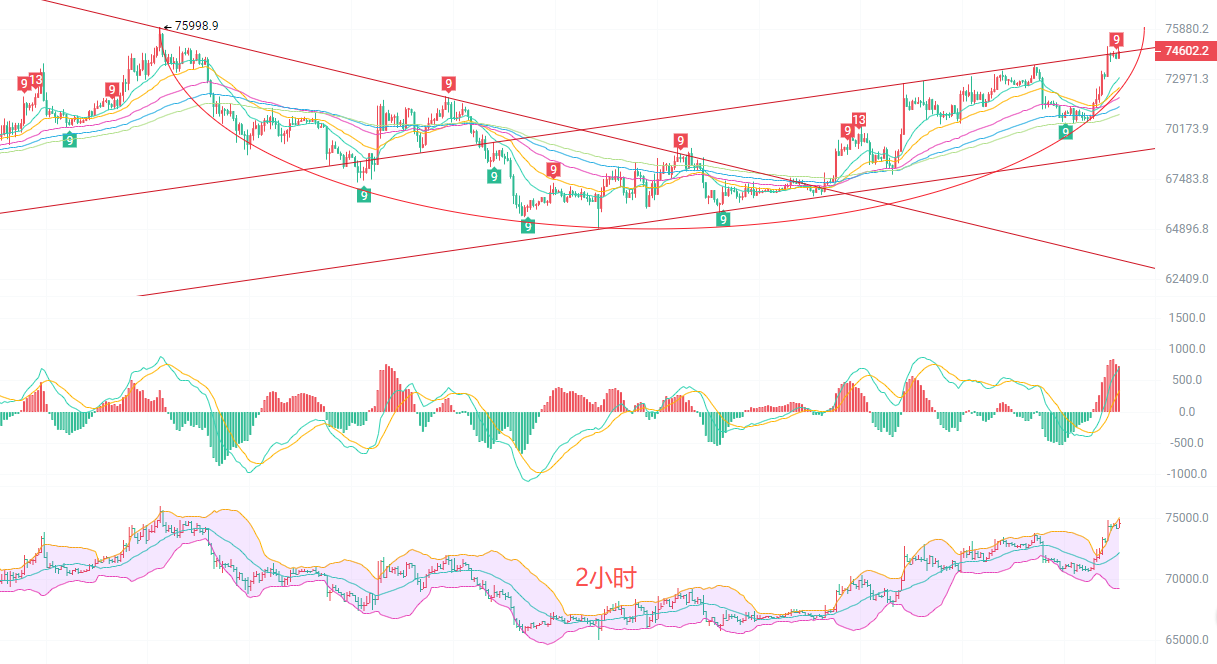
On the two-hour chart, Bitcoin is firmly above all EMA moving averages, forming a clear bullish arrangement. The moving average system reversed from a bearish trend in late March and has formed a support band that diverges upwards. The MACD red bars are continuously expanding, and the DIF and DEA are maintaining a high upward trend, indicating that bullish momentum has not significantly weakened; the Bollinger Bands are opening upwards, with prices running along the upper track, showing no obvious signs of a top divergence. The current trend has strong continuation, with short-term support rising to around EMA15.
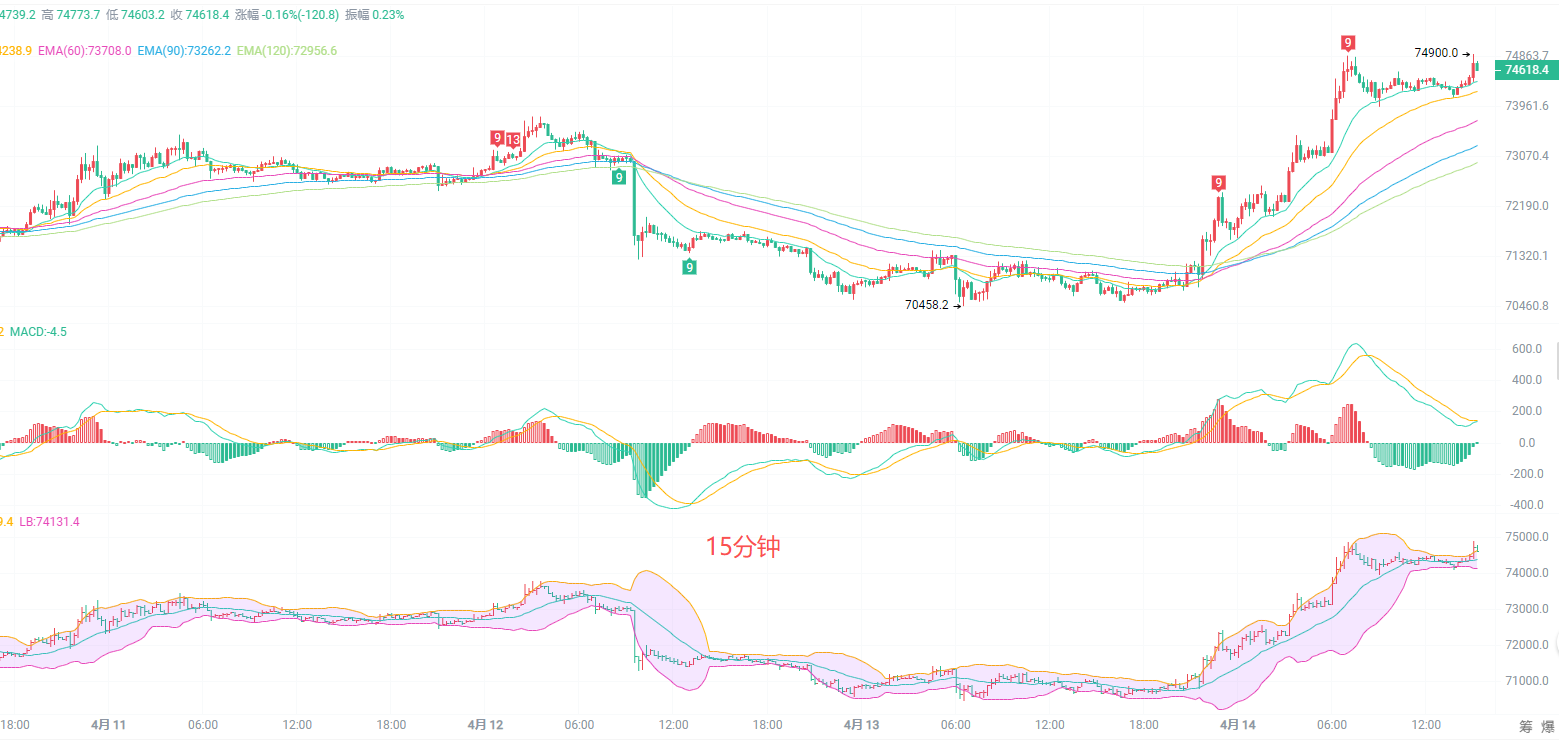
On the fifteen-minute chart, prices started from a low of 70458 and have shown a smooth upward trend, currently entering high-level fluctuations around 74500. After EMA15 and EMA30 formed a golden cross, they continued upwards, and the moving average support remains solid; however, the MACD red bars have shown reduced volume, and the DIF and DEA have signs of turning downward, indicating short-term bullish momentum is somewhat exhausted. A pressure level has formed near the upper Bollinger Band at 74510, while the lower band support is at 74197. Currently, it is in a stage of struggle between trend continuation and short-term pullback.
Latest entry reference
Enter cautiously when the price pulls back to the 74200 to 74300 range, with a stop loss at 73900 and a target of 75000 to 75500, looking to extend after a breakthrough.
If the price fails to break through and tries to probe south between 74800 to 75000, set a stop loss at 75400, with a target of 74200 to 74000. The current bullish trend is clear, and shorting is only suitable for short-term speculation, so prioritize trading with the trend and strictly control positions.
Now that the market has come this far, the biggest fear is chasing after a rise and panicking after a fall. Clearly, the trend is bullish, yet one still thinks about shorting at the top and ends up repeatedly getting smacked by the market; during a pullback, they fear falling and don’t dare to go long, watching the trend continue to rise. In fact, what one earns in the crypto world isn't just from one-off profits but a stable approach in line with the trend. Maintain good stop losses, do not go all in, and don’t get flustered by a single fluctuation. Leave the rest to the market.

Kind reminder: The above content is solely created by the author of the public account. The advertisements at the end of the article and in the comments section are unrelated to the author. Please be cautious and discern, thank you for reading.
免责声明:本文章仅代表作者个人观点,不代表本平台的立场和观点。本文章仅供信息分享,不构成对任何人的任何投资建议。用户与作者之间的任何争议,与本平台无关。如网页中刊载的文章或图片涉及侵权,请提供相关的权利证明和身份证明发送邮件到support@aicoin.com,本平台相关工作人员将会进行核查。