Abstract
• In the past week, the market was driven by a ceasefire, easing inflation, and stable policies, resulting in a sharp decline in oil prices, a drop in VIX, and a recovery in risk appetite, pushing BTC's range up to $68,000 – $73,000.
• Funds showed a strong recovery after severe fluctuations, with a net inflow of approximately $833 million into BTC ETFs in a week, marking a new high for the period, while ETH ETFs also recorded net inflows, with institutions taking the lead again.
• Trading structures shifted towards macro high-volatility assets and leading platforms, with funds concentrating on crude oil and other energy commodities, while DEX returned to high liquidity platforms like Uniswap.
• Stablecoins and DeFi exhibited structural repair, with USDC becoming the main increment, prioritizing a return of funds to leading staking protocols and main-chain lending markets.
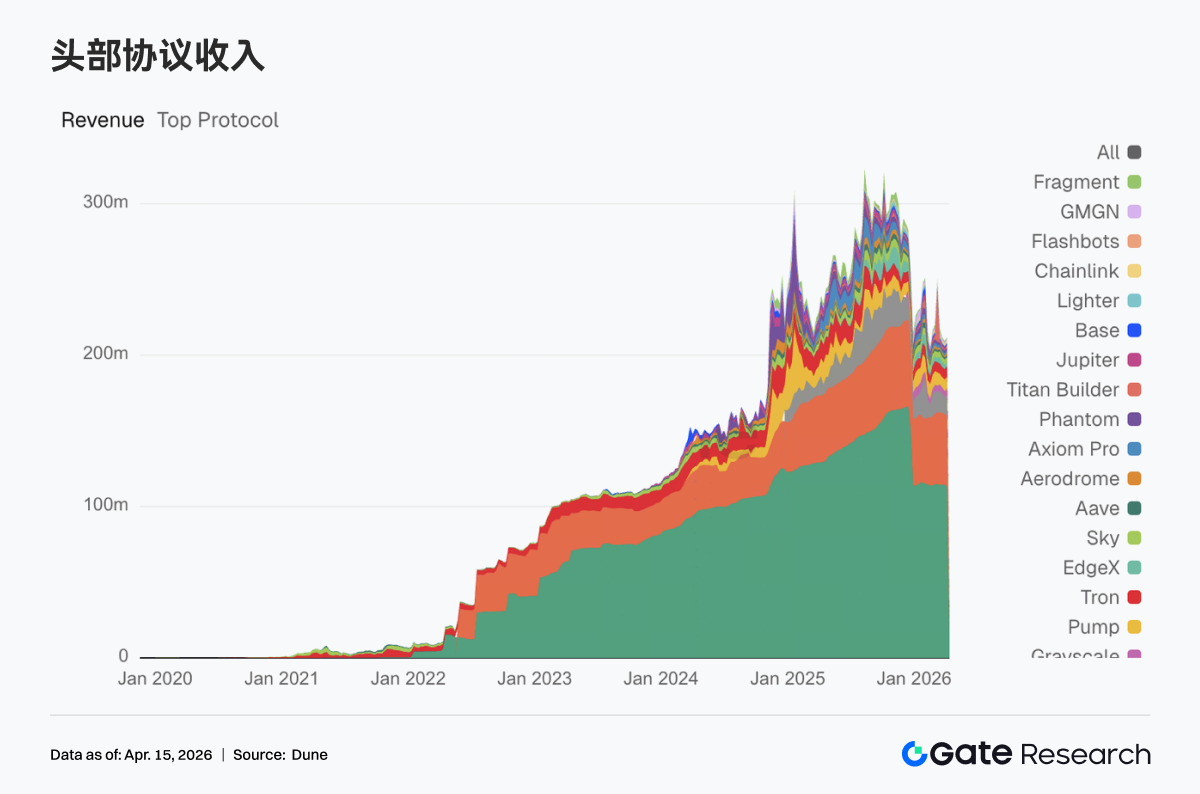
• Protocol revenues reflected a shift back to infrastructure layers, with trading and clearing protocols strengthening, and interest in front-end entry and traffic distribution tapering off.
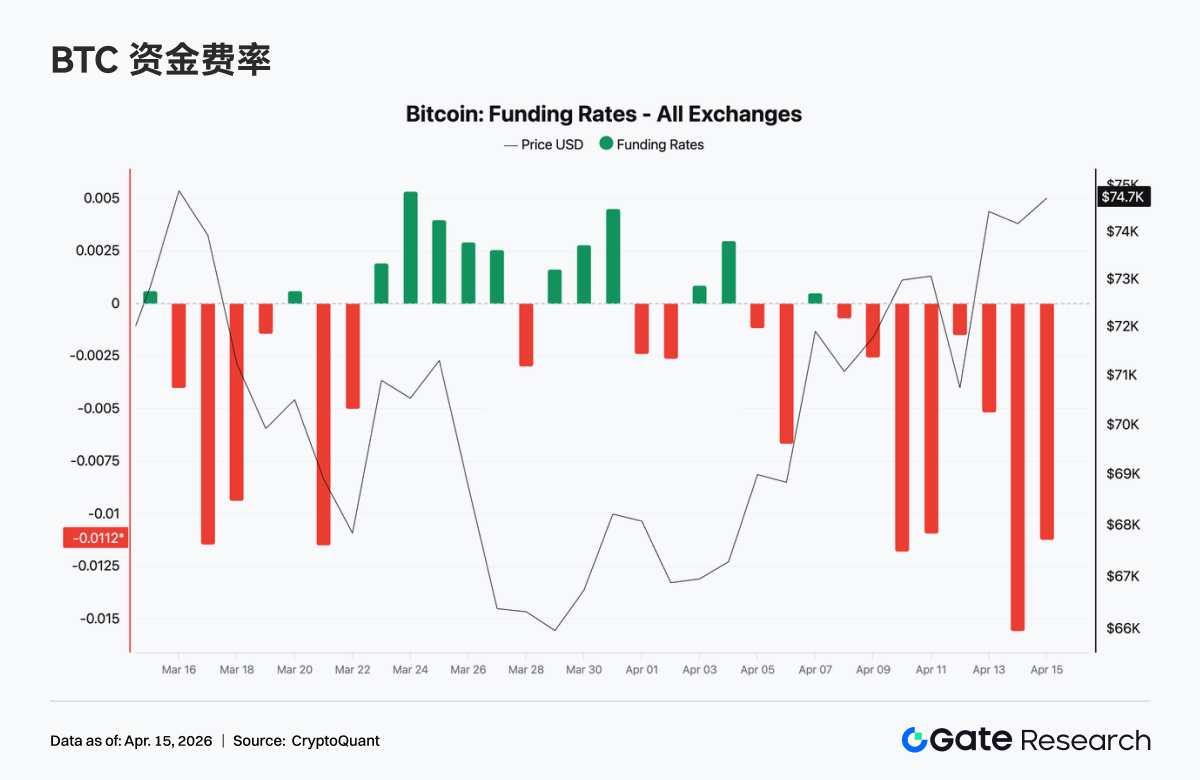
• The derivatives market showed characteristics of overcrowded shorts but a divergence in rising prices, with funding rates negative but prices increasing, indicating potential short squeeze momentum; options shifted towards short-term speculation and selling strategies.
1. Market Focus Interpretation
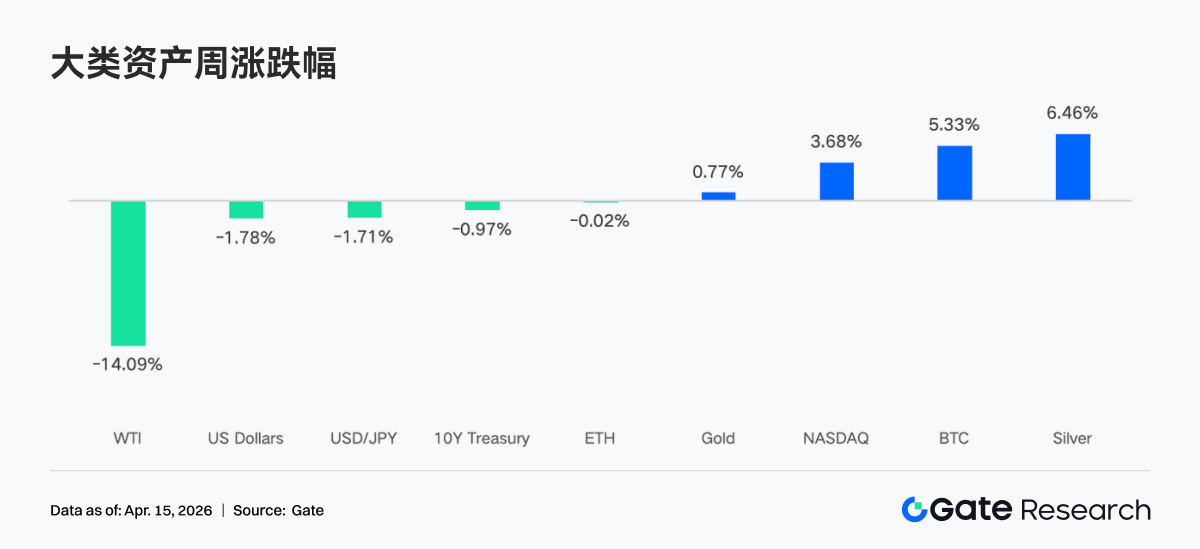
In the past week, the two-week ceasefire agreement between the U.S., Iran, and Israel brought welcome relief to this conflict that has shaken global markets. Following the announcement of the ceasefire agreement last week, the market rebounded strongly, with stock and bond prices rising, while oil prices fell by 14%, and the VIX index plummeted to 19.23, closing below 20 for the first time since early March.
Moreover, the global financial market, particularly the cryptocurrency sector, was significantly influenced by macroeconomic data and Fed policy expectations. On April 10, CPI data showed that inflation pressures were below expectations, which alleviated concerns about the Fed implementing more aggressive tightening policies, often viewed as a positive for risk assets. The meeting minutes of the Federal Open Market Committee (FOMC) released last week indicated that the market predicted a 98.4% chance of maintaining current interest rates in April. This highly certain expectation of “holding steady” provided the market with a stable policy environment, reducing short-term uncertainty.
Under the dual influence of easing inflation pressures and stable policy expectations, overall market risk appetite significantly rebounded. Institutional investors remain highly interested in cryptocurrencies, with continued inflows into Bitcoin spot ETFs providing a solid bottom support for the market. These macro factors collectively laid the groundwork for the performance of Bitcoin and Ethereum over the past week, allowing them to rebound quickly after a brief correction.
Over the past two weeks, Bitcoin's price range has quietly shifted upwards, expanding from $63,000–$70,000 to $68,000–$73,000, with the $73,000 resistance level still a key area to watch. If the reopening of the Strait of Hormuz is confirmed, it could act as a catalyst for breaking through this resistance. On the downside, Bitcoin has repeatedly found support around $68,000–$69,000, but each attempt has resulted in a narrowing support level. The cryptocurrency market has already reflected expectations of a long-term conflict, currently trading near the support range, suggesting that any positive surprises or easing of tensions may have room to rise, while further deterioration has basically been digested by the market.
2. Liquidity Analysis
2.1 BTC ETFs Register Largest Positive Week in Months
Last week, BTC ETF demonstrated vigorous fluctuations, with a net inflow of $471.4 million on April 6, marking the largest single-day inflow since late February. However, in the following two trading days, geopolitical risks surged, reversing to net outflows of -$159.1 million and -$93.9 million respectively. The weekly net inflow for BTC ETFs was about $833.2 million, while ETH ETFs recorded a net inflow of $187.0 million. In comparison to the previous week (approximately $22.3 million net inflow), the inflow rate for BTC ETFs significantly improved last week, achieving the largest positive week in months as the overall sentiment quickly shifted between risk aversion and bottom fishing, with bulls ending up in control.
Top Products by BTC ETF Net Inflows:
1. IBIT (BlackRock) – Weekly Net Inflow of $612.1 million
2. FBTC (Fidelity) – Weekly Net Inflow of $151.7 million
Top Products by ETH ETF Net Inflows:
1. ETHA (BlackRock) – Weekly Net Inflow of $168.3 million
2. ETHB (BlackRock Staked ETH ETF) – Weekly Net Inflow of $66.0 million
On April 6, institutional buying went against the geopolitical uncertainty, driving unexpected massive inflows. However, following the breakdown of U.S.-Iran negotiations on April 7 and increasing risks surrounding the closure of the Strait of Hormuz, risk aversion quickly spread, leading to two days of capital outflows—this was a mechanical tactic responding to sudden war risks rather than a long-term bearish signal. On the evening of April 8, President Trump announced that the U.S. and Iran had reached a two-week ceasefire agreement, causing oil prices to plummet, liquidity concerns to dissipate, and institutional buying to return aggressively. Additionally, the CPI data released on April 10 showed that, although nominal inflation rose to 3.3% due to energy costs, core CPI increased by only 2.6%, falling short of expectations, indicating that core inflation remains moderate, further supporting the rebound in risk assets. The ETF flows also showed a characteristic of “accelerated inflows after bad news is fully priced in.”
2.2 TradFi Liquidity
In the past week, DEX's TradFi perpetual trading exhibited significant structural differentiation, with trading focus evidently shifting towards energy-type assets. The proportion of WTI crude oil, represented by oil, significantly increased, becoming the dominant trading variety, reflecting that funds are concentrating on the most volatile macro assets for directional speculation amid escalating geopolitical risks and oil price fluctuations; simultaneously, Brent crude oil's proportion also rose significantly, further reinforcing the dominance of the energy sector. In comparison, traditional safe-haven assets like gold and silver have seen a slight decline in proportion, showing that funds are shifting from defensive allocations to higher elastic trading targets; stock indices such as XYZ100 and individual stocks like NVDA maintain a moderate proportion, taking on more of a supporting allocation role. Overall, the DEX TradFi trading structure has shifted from the previous “precious metals-dominated” to “energy-driven,” reflecting a renewed trading logic that has turned from safe-haven positioning to high-volatility trading centered around macro variables, which aligns with the trend of on-chain funds migrating to high-frequency trading links.
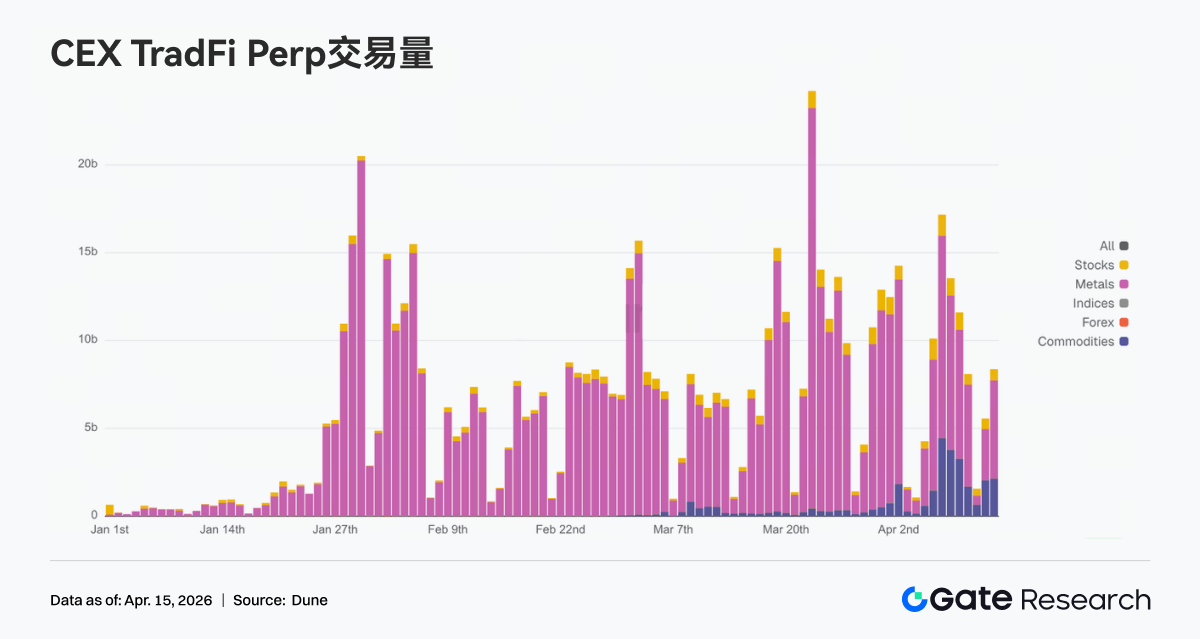
CEX TradFi perpetual contract trading volume has remained in a high range of fluctuations, showing characteristics of “structural concentration + amplified volatility.” Specifically, trading volume is still dominated by metal assets, particularly gold-related varieties, which continue to attract funds amid the backdrop of macro uncertainty and fluctuating inflation expectations, becoming the main source of trading. Meanwhile, commodity categories, especially energy, have also seen a phase increase in volume over the week, reflecting a rising trading demand for oil and macro events. In terms of rhythm, trading volume significantly expanded in the middle of the week corresponding to the catalysis of macro data and geopolitical events, and although there was a subsequent decline, overall it remained above previous mid-range levels, indicating sustained high trading activity. Structurally, TradFi trading is shifting away from reliance on a single safe-haven asset, gradually expanding into a multi-asset linkage framework of “gold + oil + indices,” reflecting that users are transitioning from position-based trading to strategy trading centered around macro volatility.
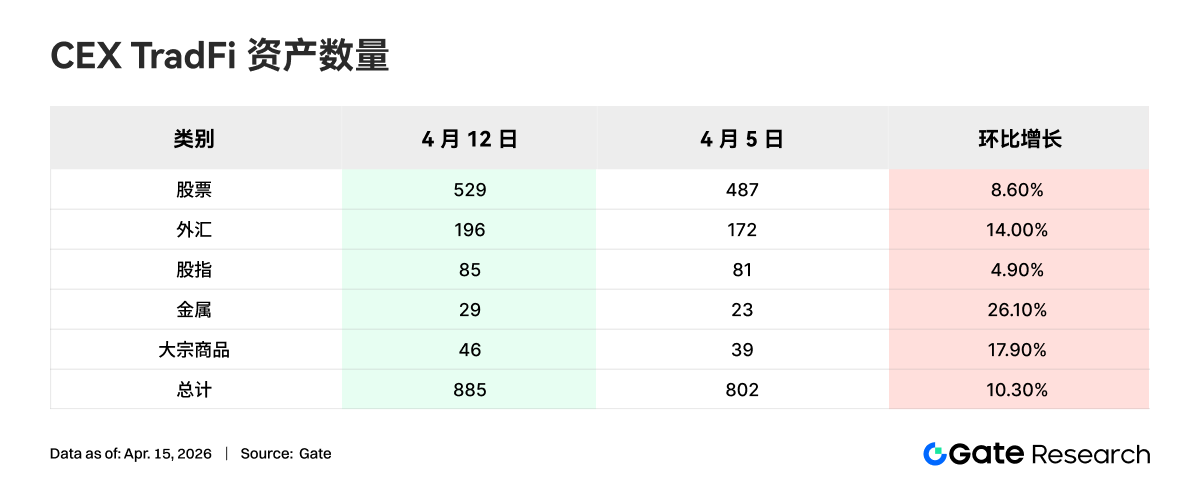
In the past week, the number of asset categories in CEX TradFi further expanded, with the total number of mainstream CEX in TradFi asset categories (counting only TradFi and CFD segments, excluding perpetual contracts) increasing from 802 to 885, a week-on-week growth of 10.3%. Among them, metal categories saw the most significant increase, rising from 23 to 29, representing a week-on-week growth of 26.1%; the rate of increase in bulk tracked second, rising from 39 to 46, a week-on-week growth of 17.9%.
We selected XAUT with the highest TradFi trading volume to analyze its order book depth (Delta). In the past week, the depth of XAUT's order book exhibited characteristics of “weak at first, strengthening later, with liquidity gradually recovering.” Around April 8, the price of XAUT rebounded rapidly, with a notable increase in positive Delta and enhanced buy depth, indicating that funds began to actively raise prices and provide liquidity above. However, during the period from April 9 to April 12, although the price remained in high-level fluctuations, the order book shifted back to a predominant negative Delta, suggesting that selling pressure above still exists, indicating some divergence at high levels. Notably, the positive Delta rose again over the weekend and was accompanied by a strengthening price, indicating that buying liquidity regained superiority and market sentiment was somewhat repaired. Overall, the depth structure of XAUT reflects the transition from defensive withdrawal of capital to reallocation amid a rising gold price backdrop, with liquidity showing marginal improvement in the short term, although selling pressure remains at high levels, making continued buying power crucial to monitor.
3. On-chain Data Insights
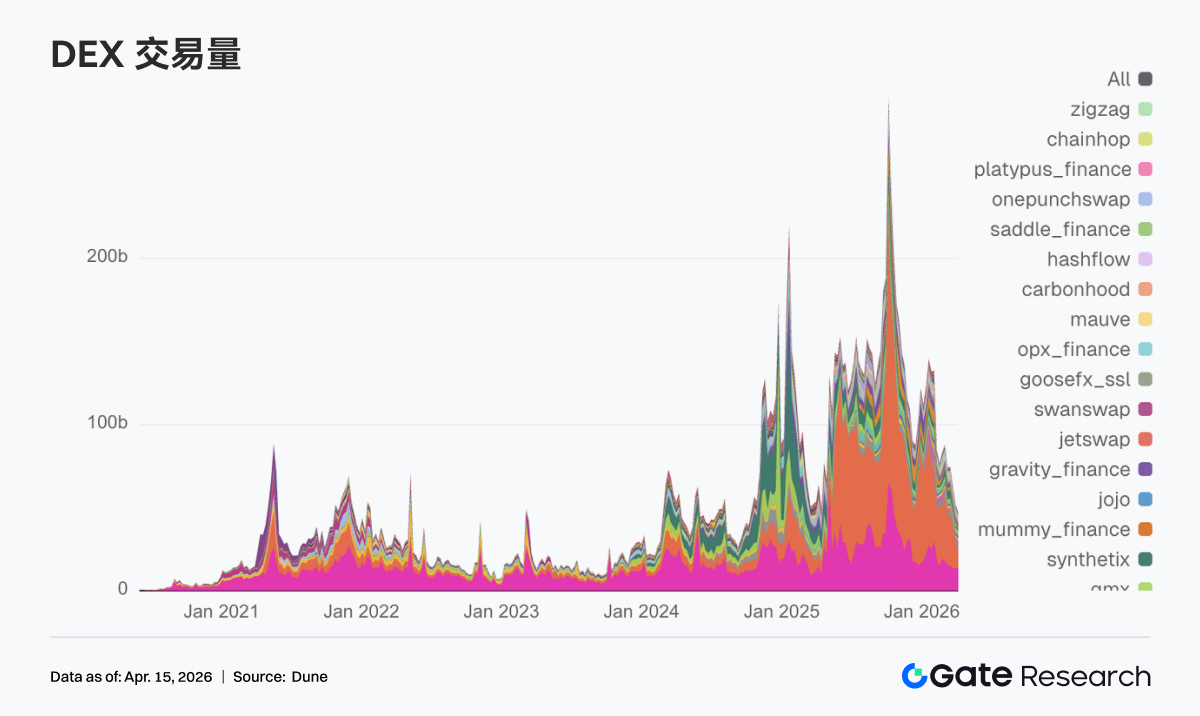
3.1 DEX Trading Focus Returns to Leading EVM Platforms, Uniswap Back on Top
DEX trading volume returned to Uniswap, with a weekly transaction volume of $13.85 billion, followed closely by PancakeSwap at $10.33 billion. Compared to last week, PancakeSwap experienced a decline, while Uniswap significantly rose, reflecting the return of funds to the more liquid and mature trading pairs on the main platforms. Additionally, DEX platforms represented by Aerodrome and Bisonfi attracted some active funds, while Whirlpool, Raydium, and Humidifi all saw declines, indicating a lack of widespread trading within Solana’s ecosystem.
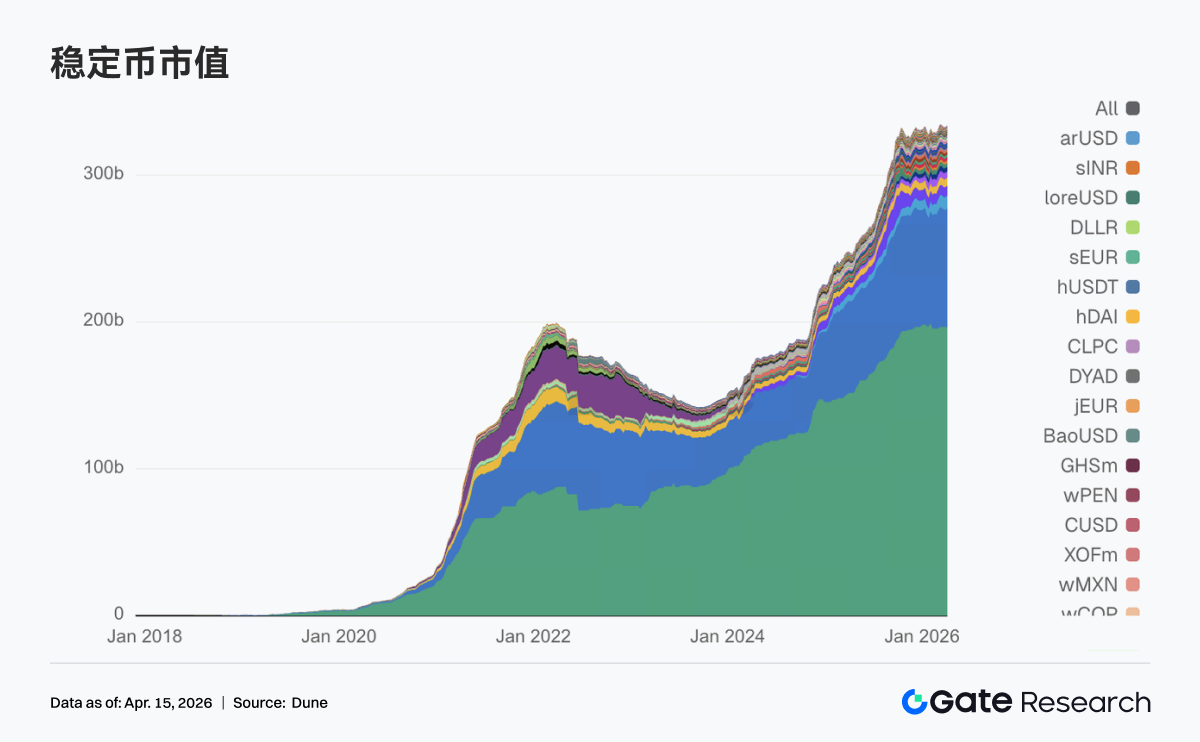
3.2 The Total Amount of Stablecoins Remains High, USDC is the Main Increment Source
This week, the stablecoin sector did not experience drastic fluctuations and underwent structural adjustments within a high-level range. USDT remained relatively stable compared to the previous week, with underlying dollar liquidity still steady. USDC rose from $798.68 billion to $810.49 billion, becoming the most explicit source of increment this week, indicating a reallocation of funds towards mainstream dollar-denominated assets. On the other hand, USDS, USDe, DAI, and GHO all showed slight declines, and the decentralized stablecoin segment failed to form a cohesive movement this week. In terms of marginal changes, both USDG and PYUSD rose, showing that there is still ongoing fund distribution between payment-type and newly issued stablecoins.
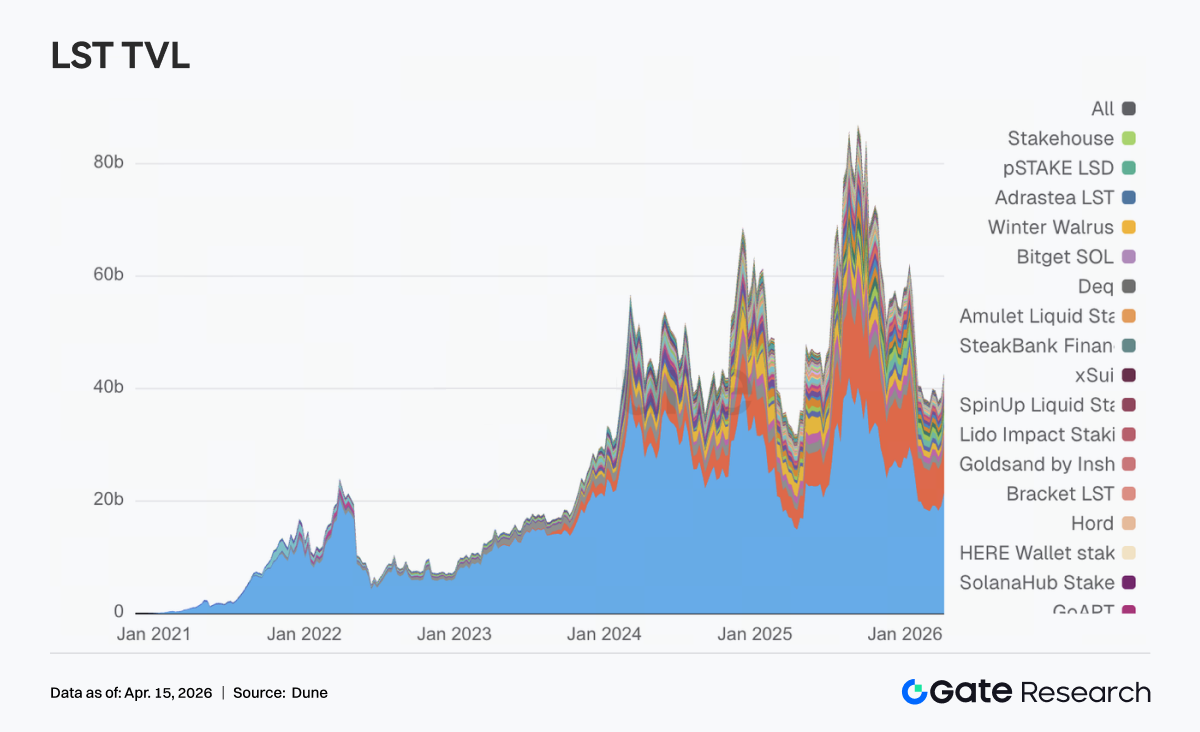
3.3 Liquid Staking Experiences Uniform Recovery, ETH and SOL Positions Increase Simultaneously
This week, leading protocols in the liquid staking sector mostly recovered from previous withdrawals. On the ETH side, Lido rose to over $21 billion, and Rocket Pool also reconquered $1.3 billion, with leading protocols overall showing strength. The SOL direction also experienced recovery, with Sanctum Validator LSTs rising to $1.13 billion, and Jito and Jupiter Staked SOL both demonstrating significant increases. This week represented a unified recovery following a warming of risk appetite, with funds first replenishing positions in leading protocols. Meanwhile, Lido's recent focus on products around EarnETH, EarnUSD, and first-loss protection has continually refined yield and risk tiering, and these more institutional-oriented tools have helped enhance the willingness of large funds to return.
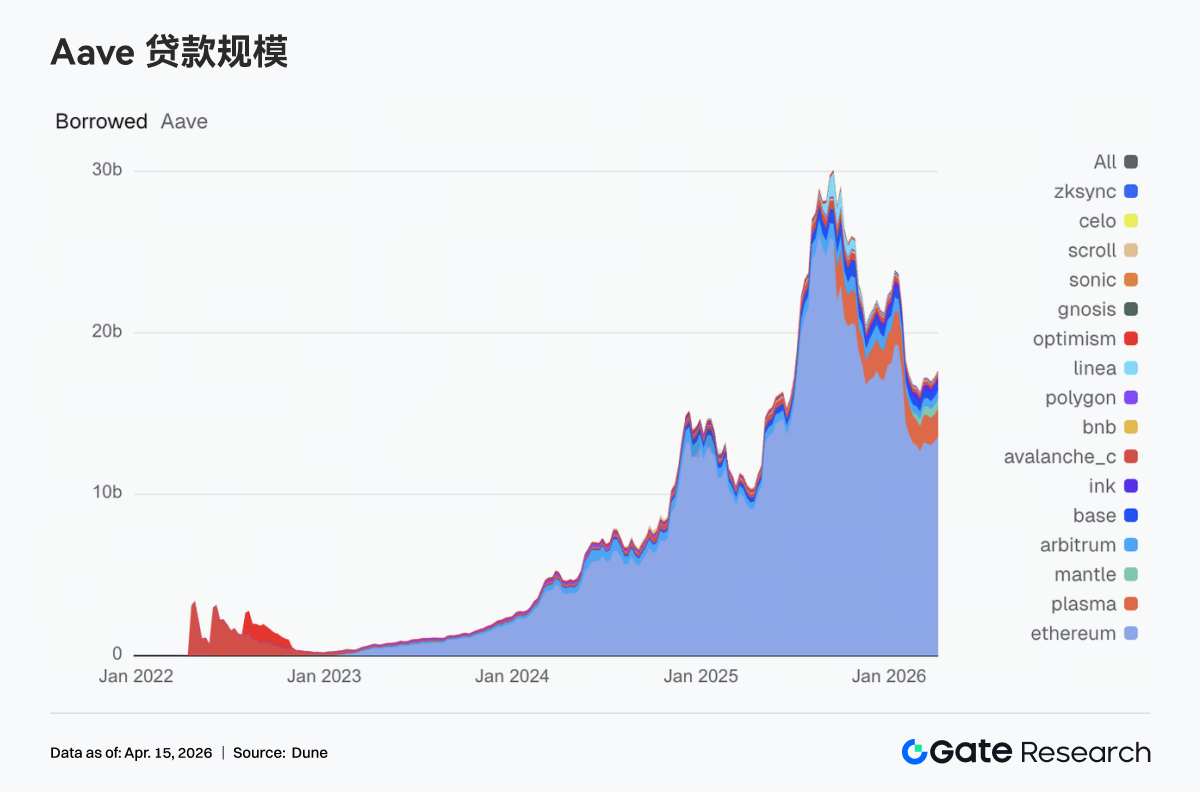
3.4 Aave Lending Scale Turns Upwards, Core Markets Drive Alongside Mantle and Plasma
Aave’s lending scale increased to approximately $17.69 billion, up from $17.25 billion the previous week. The Ethereum main market rose from $13.27 billion to $13.57 billion, becoming the core driving force behind the total volume. Concurrently, Plasma increased from $1.66 billion to $1.71 billion, while Mantle rose from $590 million to $640 million, with Base and Arbitrum also around $517 million, indicating simultaneous warming of multichain lending demand. In contrast, secondary markets such as Avalanche, BNB Chain, and Polygon showed little change, with new financing demand mainly concentrated on the few main chains with the deepest liquidity and highest trading efficiency.
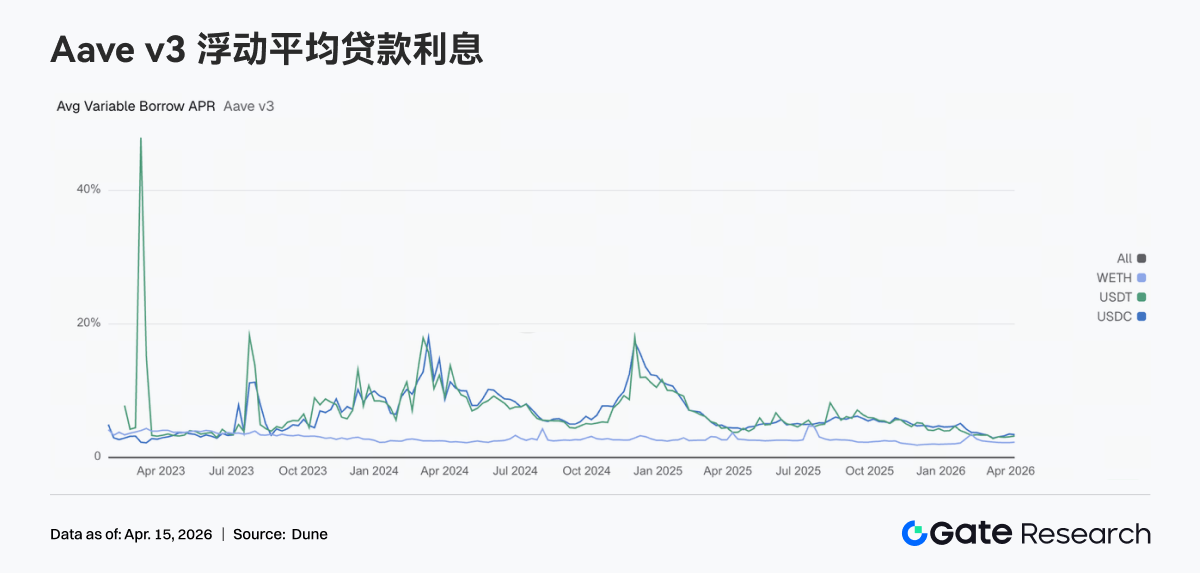
3.5 Aave Funding Rates Diverge, USDC Eases, USDT and WETH Rates Rise
The three core assets of Aave did not move in the same direction. The average floating borrowing APR for USDC fell from 3.51% to 3.42%, slightly alleviating funding pressure; whereas USDT rose from 3.10% to 3.22%, and WETH also increased from 2.23% to 2.29%, with borrowing costs beginning to skew towards these two assets. This combination typically corresponds to a clear trading state, indicating that although total borrowing scale is growing, new financing demand has not continued to concentrate on USDC but has partly returned to USDT circulation and ETH position management. If Aave V4 can truly realize risk isolation and cross-market routing, the interest rate disparities between different assets may be further amplified, with the initial signs of this trend already observable this week.
3.6 Protocol Revenues Return to the Rhythm of Trading Infrastructure Rotation, Hyperliquid Shows Significant Rebound
This week, the protocol revenue sector did not display any abnormal peaks. Tether and Circle continue to hold the top two positions, with stablecoin issuance still being the most solid foundation in the current crypto revenue system. In terms of trading protocols, Hyperliquid rose from $11.32 million to $13.68 million, Titan Builder jumped from $558,000 to $1.44 million, and Aerodrome rose from $1.113 million to $1.96 million, with funds and trading flow concentrating back to more efficient infrastructure layers.
In contrast, Phantom fell from $1.976 million to $1.332 million, and Jupiter dropped from $1.541 million to $928,000, indicating a decrease in interest in front-end traffic entry and distribution layers. Aave's revenue rose to $1.441 million, although its elasticity is not significant, but it remains relatively stable, with the profitability quality of lending protocols still significantly better than that of high-turnover platforms. Overall, the messages released from the income aspect are clear: the market has not departed from trading; funds have simply returned to more efficient transaction capacities, stronger clearing abilities, and steadier cash flow quality in the infrastructure segment.
4. Derivatives Tracking
4.1 BTC Funding Rates Turn Deeply Negative but Prices Strengthen, Open Interest Quickly Rises to High Levels
In the past week, BTC funding rates consistently remained in negative territory, and around April 13, they experienced a phase of extreme negativity (lowest close to -0.015), reflecting that bearish sentiment dominated the perpetual contract market, with short overcrowding significantly increasing. However, concurrently, spot prices rebounded from around $69K to above $74K, creating a typical structure of rising prices but negative funding rates. This structure usually suggests that while bears passively pay funding fees, they also bear pressure from rising prices, indicating potential short squeeze momentum. Overall, the market is in a stage dominated by bearish sentiment but driven upward by spot or structural buying, which could easily trigger short-covering and accelerated upward movement in volatility.
The total open interest across the BTC market quickly rose from about $22.5 billion to around $25.3 billion over the past week, rebounding alongside prices to above $74K, indicating significant capital reinflow into the market. It is noteworthy that there was a sharp decrease in open interest on April 11 (similar to central liquidation or outflow), which quickly repaired and reached new highs, signaling that after weaker positions are washed out, new trend capital is stepping in. Given that funding rates remain persistently negative, the current rise in open interest may be driven by short positions and hedging, with the market in a high-leverage, directional divergence but predominantly bearish state; if prices continue to rise, there is still room for further short squeezes.
4.2 Event-Driven Short-Term Crowding, Mid- to Long-Term Defensive
The option trading and open interest structure display event-driven characteristics. Monthly and daily options synchronously expanded, with daily options peaking during the week on 4/10, engaging in high-frequency speculation revolving around the oscillation following the ceasefire's disconfirmation; monthly options concentrated in volume during the ceasefire expectations phase from 4/7–4/8, reflecting institutions adjusting mid-term directional strategies during the geopolitical window period. In contrast, cyclical options continue to shrink, suggesting the lack of clear directional consensus in the 1–2 week dimension. From the expiration structure, trading mainly concentrated on contracts expiring that day and those expiring next Friday, indicating significant demand for short-term defense; mid- to long-term transactions decreased, reflecting an overall neutral positioning. In the large transaction domain, BTC is primarily involved in term structure arbitrage (long short-end vol, short mid vol), while ETH has dominated with selling spreads, indicating that the current market is largely engaged in volatility structure and range speculation, rather than unilateral directional betting.
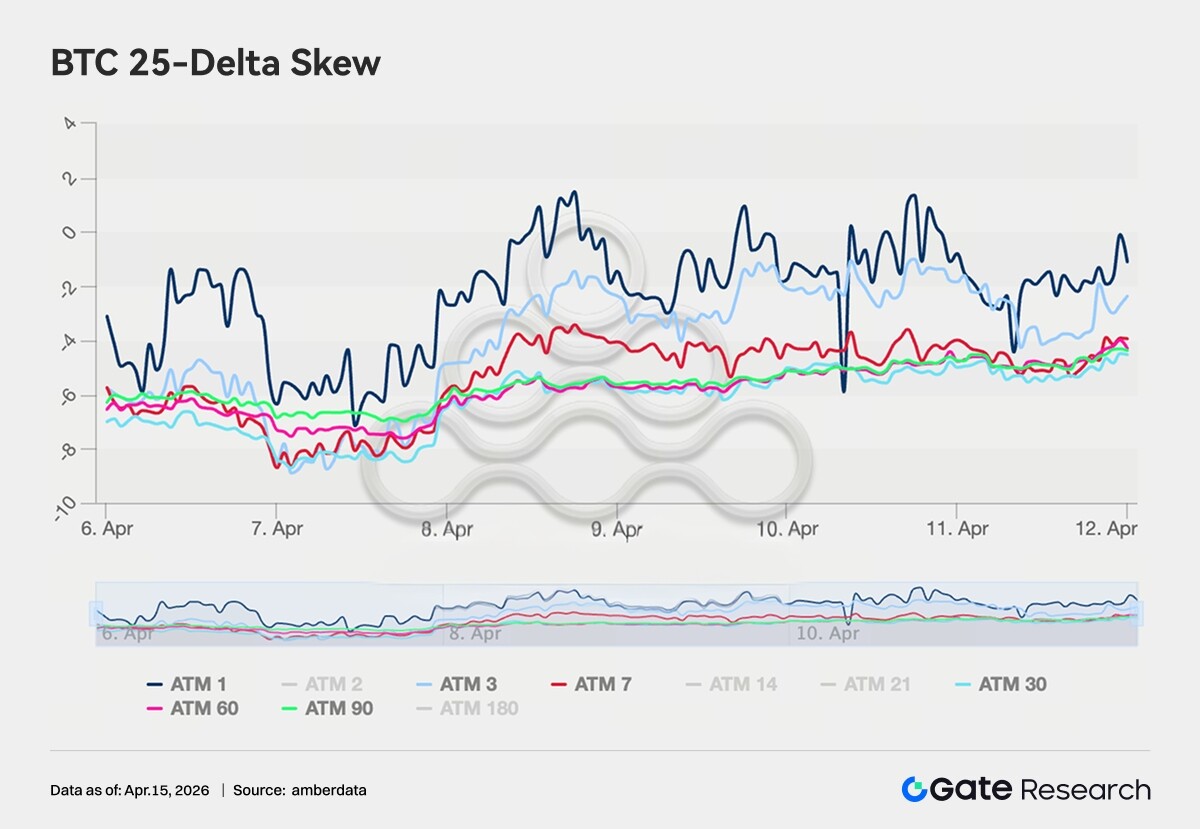
4.3 Defensive Premiums Persist, but Bearish Sentiment Slightly Eases
The 25-Delta Skew for BTC remains in the range of -4 to -8 vol across all expirations, with put premiums still dominating, indicating that the market maintains an overall demand for hedging against downside risks. However, compared to the extreme range of -8 to -11 vol at the end of March, the Skew has evidently risen by about 2–3 vol points, reflecting a slight easing of bearish sentiment. The changes in ETH Skew are more pronounced, having moved from the previous range of -5 to -8 vol up to -3 to +2 vol overall, with some maturities even nearing symmetry, indicating that the market's pricing for tail downside risks has contracted significantly. Nevertheless, long-end Skew has not yet significantly turned positive, and the institutional layer has not fully shifted to offensive strategies, maintaining an overall state of reducing defense but not entirely releasing it.
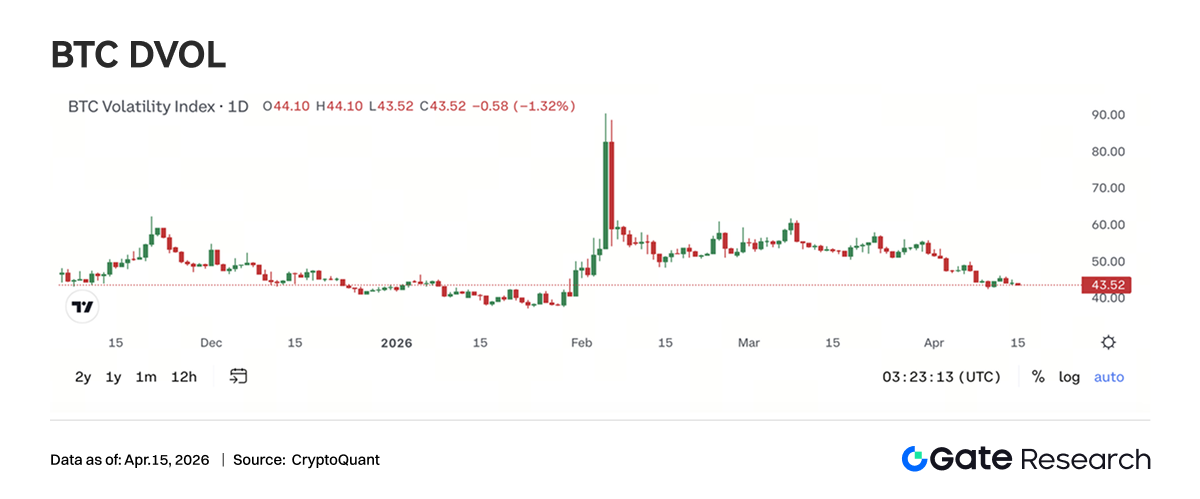
4.4 DVOL Returns to Baseline Range, Volatility Premium Enters Compression Phase
The current BTC DVOL is about 44.76, having steadily declined from the extreme level of 90+ triggered by geopolitical conflicts in early February, returning to the baseline range of mid-January. The ceasefire event in April only produced a brief pulse (45→50), followed by a quick decline, indicating that the market no longer assigns high volatility premiums to singular geopolitical events. Currently, DVOL is close to the half-year average support range (45–48), and if it further dips to around 40, it will enter historically low volatility territory. The current ETH DVOL is approximately 65.50, also retreated to pre-conflict levels but is still about 20 vol points higher than BTC. With a substantial volume of selling spreads and volatility strategies in large transactions, it can be confirmed that mainstream market judgment currently views the environment as low volatility and oscillating. Overall, volatility has entered the final compression phase, with seller earnings narrowing, while simultaneously providing a more cost-effective entry window for medium-term volatility-buying strategies.
5. Outlook for the Week
6. Gate Institutional Dynamics Update
Trading Performance: Structural Optimization, Overall Outperforming the Market
• Spot and contract trading overall outperformed the market, with contracts leading the industry.
• After iterations of the market-making fee rate and assessment rules, the activity of mid-tier clients has significantly increased, and trading structures continue to optimize.
CrossEx: Trading Volume and Asset Depth Hit Historic Highs, Accelerating Collaboration with Asset Management Platforms
• CrossEx incentive activities continue to drive recharge and increase trading volume, with multiple clients entering real accounts and strategy phases, record highs for both trading volume and asset depth achieved;
• Ongoing推进与资产管理平台、OTC贷款的联动
Funding Business: Demand Continues to Warm, Structural Differentiation
• Current and full-position lending scales have increased significantly.
• Lending demand for ETH, USDT, and popular assets has rebounded considerably.
Technical Progress: Dual Enhancement of Performance and Functionality
• Websocket SBE launched, enhancing data transmission efficiency.
• AI customer service robot has been preliminarily implemented, gradually empowering BD and customer service.
Data Sources
• Investing, https://investing.com/currencies/xau-usd-historical-data
• Gate, https://www.gate.com/trade/BTC_USDT
• CMC, https://coinmarketcap.com/real-world-assets/?type=all-tokens
• Coinglass, https://www.coinglass.com/pro/depth-delta
• Dune, https://dune.com/gateresearch/gate-tradfi#weekly-volume
• Dune, https://dune.com/gateresearch/gate-institutional-weekly-report
• Bybit, https://www.bybit.com/future-activity/en/tradfi
• Bitget, https://www.bitgettradfi.com/tradfi/XAUUSD
• CryptoQuant, https://cryptoquant.com/asset/btc/chart/derivatives
• Amberdata, https://pro.amberdata.io/options/deribit/btc/current/
Gate Research Institute is a comprehensive research platform on blockchain and cryptocurrency, providing readers with in-depth content, including technical analysis, market insights, industry research, trend predictions, and macroeconomic policy analysis.
Disclaimer
Investing in the cryptocurrency market involves high risks, and users are advised to conduct independent research and fully understand the nature of the assets and products purchased before making any investment decisions. Gate is not responsible for any losses or damages arising from such investment decisions.
免责声明:本文章仅代表作者个人观点,不代表本平台的立场和观点。本文章仅供信息分享,不构成对任何人的任何投资建议。用户与作者之间的任何争议,与本平台无关。如网页中刊载的文章或图片涉及侵权,请提供相关的权利证明和身份证明发送邮件到support@aicoin.com,本平台相关工作人员将会进行核查。


