Coin Waves: 4.20 Ethereum (ETH) Market Analysis Reference:
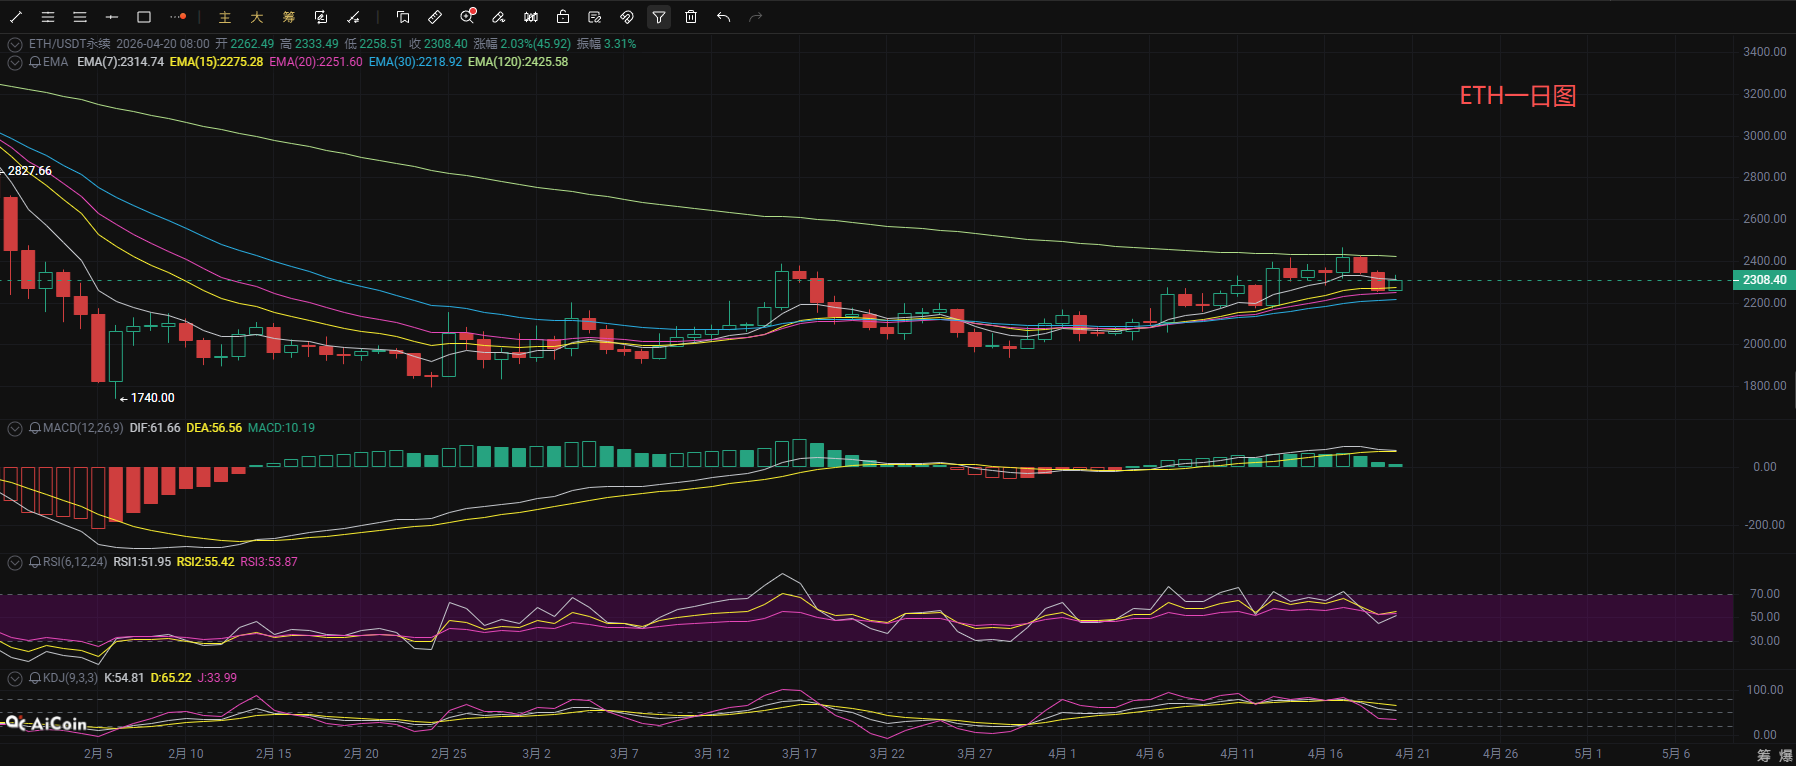
Ethereum's daily chart is currently in a high-level consolidation phase after a previous rise, with the price running above the middle line of the Bollinger Bands. Although it has retraced from recent highs, it still relies on the EMA30 moving average to maintain itself within an ascending channel. The moving average system remains in a bullish arrangement, and the medium to long-term trend has not deteriorated; the MACD indicator is continuously reducing in volume, with bullish momentum significantly waning. The DIF line is still above the DEA line, but the difference is continually narrowing; the RSI indicator is hovering in the 50-60 range, indicating a balance between buying and selling forces; the KDJ indicator’s J line has retraced, showing a short-term need for a corrective recovery. Strong resistance is located near the upper Bollinger Band at around 453, while critical support resides at the MEA20 and EMA30. If these support levels can hold, it is likely to maintain high-level volatility; if they break, a new round of deep retracement may begin.
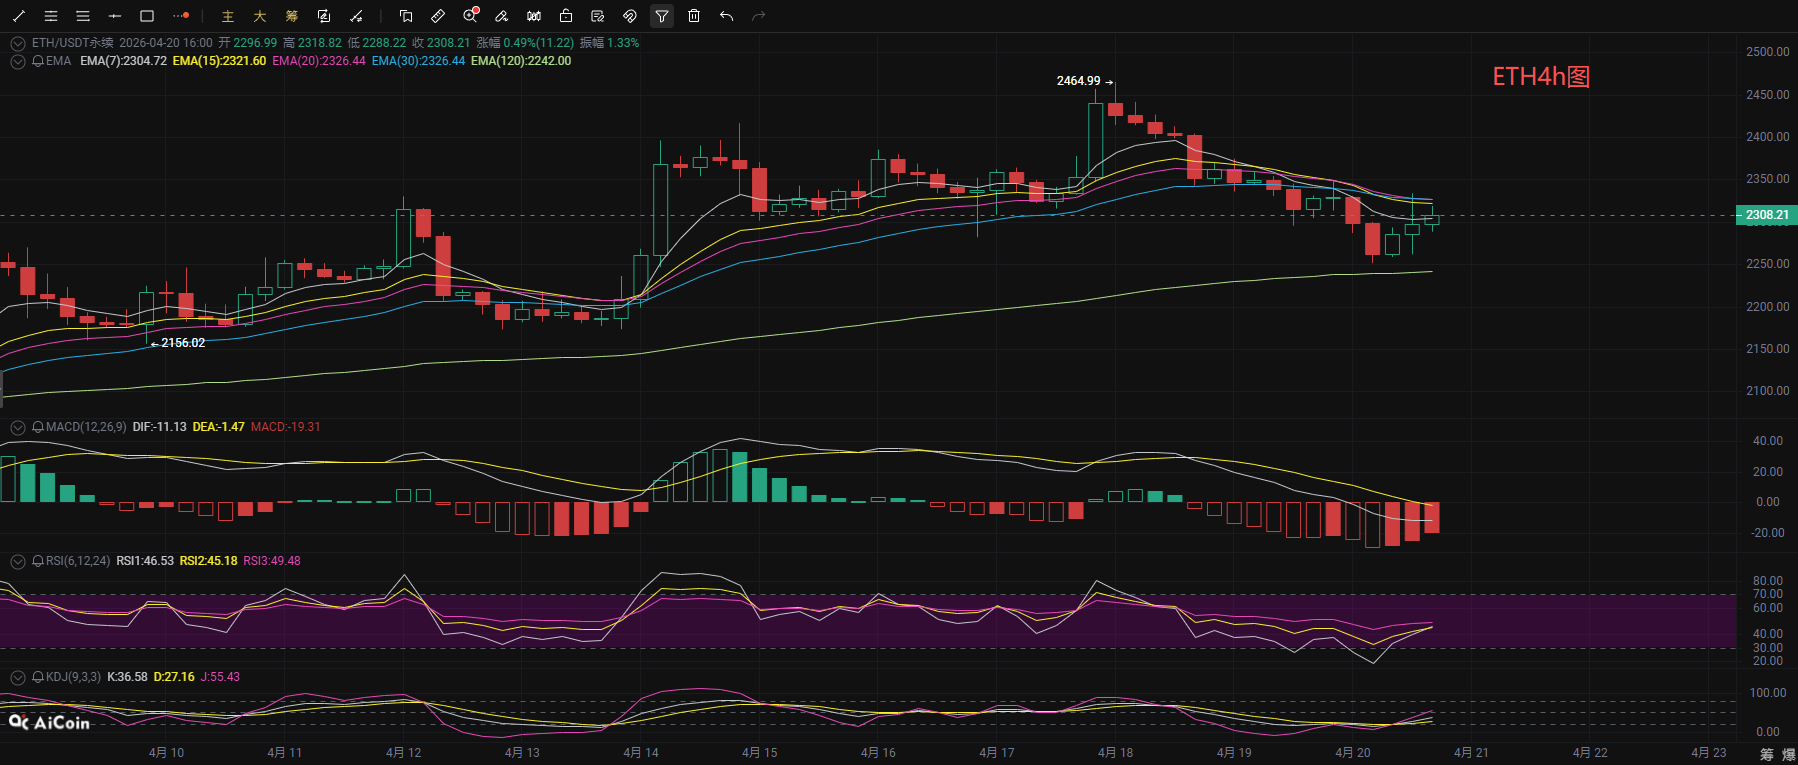
The 4-hour chart of Ethereum has entered a correction cycle, with the price fluctuating near EMA7, having broken below the short-term EMA15 and EMA20. The Bollinger Bands are converging, and the volatility range is narrowing. The MACD indicator’s DIF line has crossed below the DEA line, forming a death cross and continuously releasing bearish momentum; the RSI indicator has turned upwards from lower levels into the neutral zone, while the KDJ indicator has also turned upwards from lower levels, indicating short-term potential for a small rebound. Resistance is concentrated in the resonance area between the middle Bollinger Band at 2347 and the short-term EMA lines, while support is located near the lower Bollinger Band at around 2252. Short-term operations should treat the situation as range-bound volatility, focusing on the breakthroughs of key support and resistance levels.
Coin Waves: 4.20 Ethereum Short-Term Reference:
Sell Order: Short in the range of 2380-2350, stop loss 30 points, target at 2300-2250,
Buy Order: Long in the range of 2220-2260, stop loss 30 points, target at 2300-2350,
[The above analysis and strategies are for reference only. Please bear the risks yourself. The article's review and publication may have delays, and strategies may lack timeliness. Please do not operate blindly.]

The content of this article is originally shared by [Coin Waves], representing personal opinions only. The article is sent with delays and is for reference only; please do not operate blindly! Want to receive more daily real-time trades? Then follow my public account! Here, you can engage in online technical learning on the charts and learn related knowledge about exiting positions. I have many years of research experience in the market, focusing on large trends in the cryptocurrency space. I mainly analyze and guide the investment operations of BTC, ETH, SOL, BCH, etc. Welcome to study and research together.
免责声明:本文章仅代表作者个人观点,不代表本平台的立场和观点。本文章仅供信息分享,不构成对任何人的任何投资建议。用户与作者之间的任何争议,与本平台无关。如网页中刊载的文章或图片涉及侵权,请提供相关的权利证明和身份证明发送邮件到support@aicoin.com,本平台相关工作人员将会进行核查。