On the afternoon of April 23, ETH conceals a deadly trap! Bullish momentum weakens, will it pull back or surge again?
The current price of ETH is 2351, seemingly rebounding strongly along with BTC, but in reality, it has reached the end of its upward push! Many are saying a breakthrough above 2500 is imminent, but the technical indicators have already signaled a pullback!
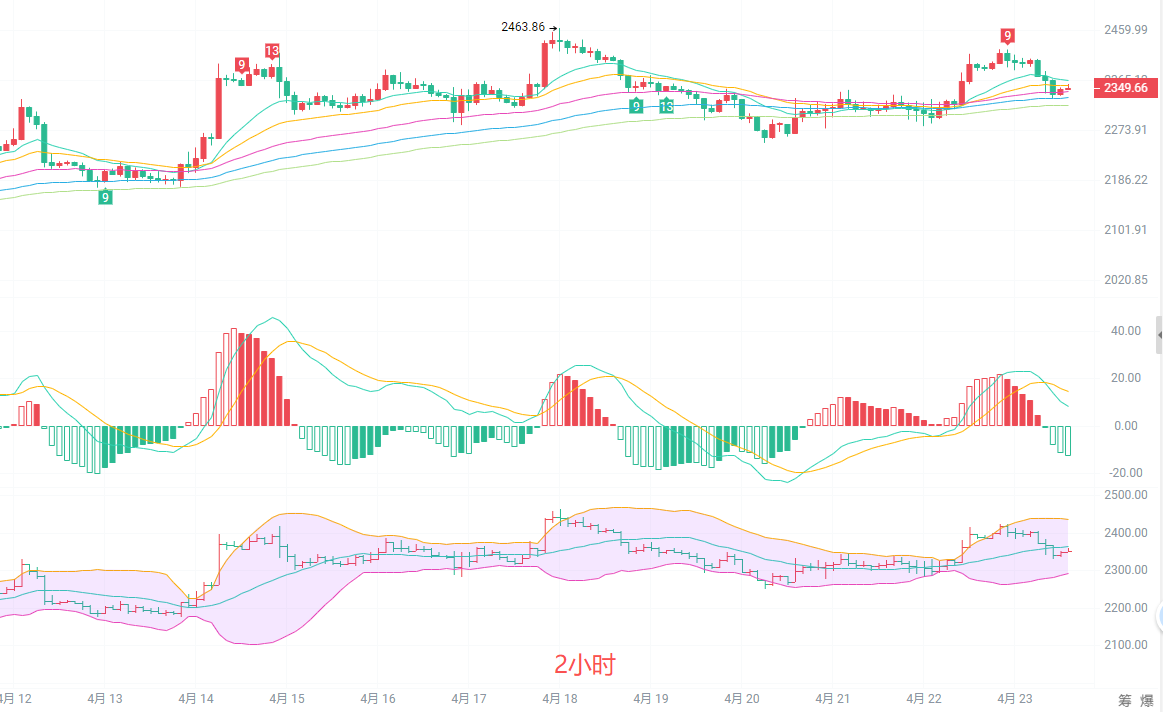
From the 2-hour cycle, ETH still maintains an upward channel overall, with prices consistently running above all EMA lines. The upward arrangement of moving averages provides multiple layers of support, indicating that the mid-term rebound trend has not fundamentally changed. However, the MACD indicator shows that the red bars are continuously shortening, and DIF and DEA are closely bound at high levels, indicating a significant reduction in upward momentum and the accumulation of top divergence risk. The upper Bollinger band has flattened, and prices repeatedly test the upper edge of the band, indicating that selling pressure is gradually increasing, significantly raising the probability of a short-term pullback to the mid-line at 2320, with extremely high risks of chasing higher prices at elevated levels.
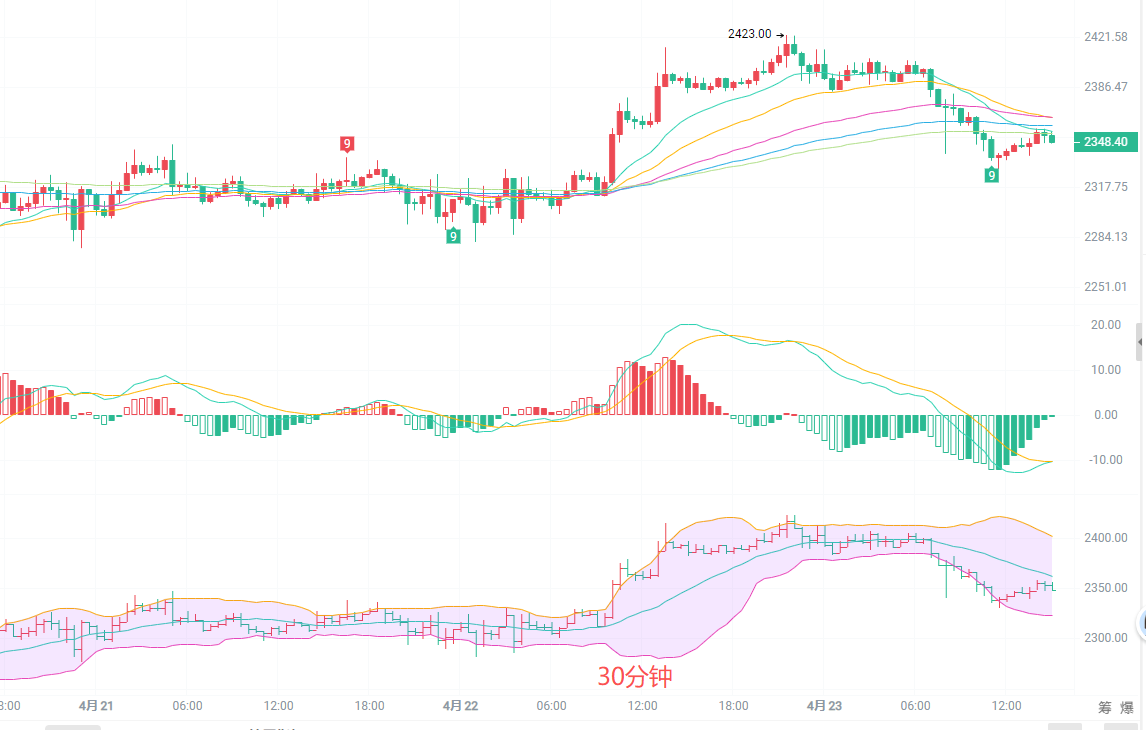
The signals from the 30-minute cycle show that the short-term upward rhythm has been disrupted. After the price fell below the EMA15 moving average, short-term support turned into resistance, with the EMA30 moving average becoming the current key defensive level for prices. The MACD indicator formed a death cross, and green bars are continuously expanding, with downward momentum starting to dominate, clearly signaling a pullback. The Bollinger channel has shifted from expansion to convergence, and prices fell below the mid-line, entering a weak zone. The fluctuation range has narrowed to 2330-2370, and the signs of consolidation after an upward divergence are evident, offering better short-term opportunities for downward trades.
Latest references for north and south:
Downward from 2365-2375, stop-loss at 2392, target 2335-2315
Upward from 2315-2330, stop-loss at 2298, target 2360-2390
The current ETH is a typical example of following the rise without resisting the fall; it rushes with the trend when rising but drops faster than anyone else when falling. The high-level sideways movement is consuming upward momentum. Chasing the price higher now easily gets one stuck at the peak as a bag holder. Regardless of bullish or bearish positions, stop-losses must be implemented, don't hold onto positions; if BTC pulls back, ETH will not hold up at all!

Kind reminder: The above content is solely created by the author for the official account. Advertisements at the end of the article and in the comments section are unrelated to the author. Please identify carefully, thank you for reading
免责声明:本文章仅代表作者个人观点,不代表本平台的立场和观点。本文章仅供信息分享,不构成对任何人的任何投资建议。用户与作者之间的任何争议,与本平台无关。如网页中刊载的文章或图片涉及侵权,请提供相关的权利证明和身份证明发送邮件到support@aicoin.com,本平台相关工作人员将会进行核查。