Cryptocurrency Expert: How far can this rebound of Ethereum go on April 24? Be cautious of the 4-hour divergence signal! Latest market analysis and trading suggestions
Current price of Ethereum is 2310, and the battle between bulls and bears has reached a critical point. Many people cannot see the current trend clearly, blindly chasing highs and lows, resulting in repeated losses. Today, combined with the daily and 4-hour dual cycles, we will break down the core signals of EMA moving averages, MACD, and Bollinger Bands, providing clear entry points for bulls and bears as well as stop-loss levels, helping you clarify the current market structure, avoid traps of false breakouts, seize certain opportunities, and be able to execute trades directly after reading, instead of being swayed by market emotions.
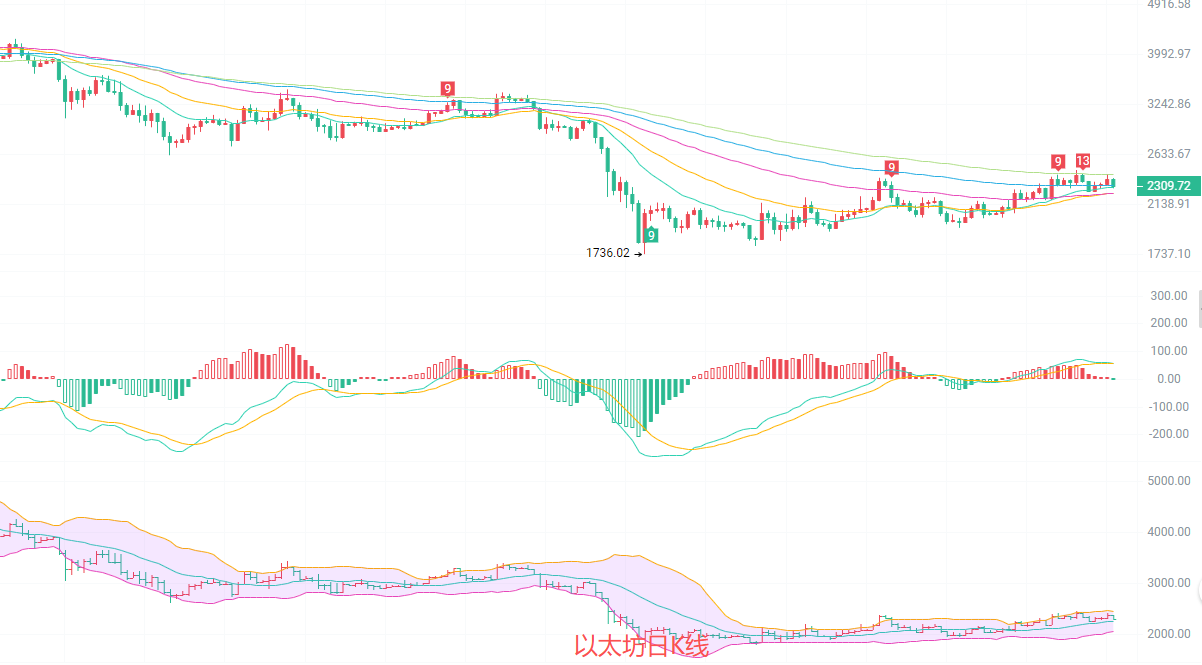
On the daily level, ETH closed at 2305 and is still within the volatile range after a low rebound. The moving average system's northward arrangement has not been broken, but the price has fallen below the EMA15 short-term moving average, indicating weaker upward momentum. The MACD indicator shows that the red bars are continuously shortening, and the DIF line and DEA line are near a death cross, indicating that the pressure for a pullback is evident on the daily level. The middle line of the Bollinger Bands at 2267 provides strong support, while the upper line at 2461 serves as key resistance. The current price is in the volatile center and the direction is not yet clear, with the overall focus still on range repair.
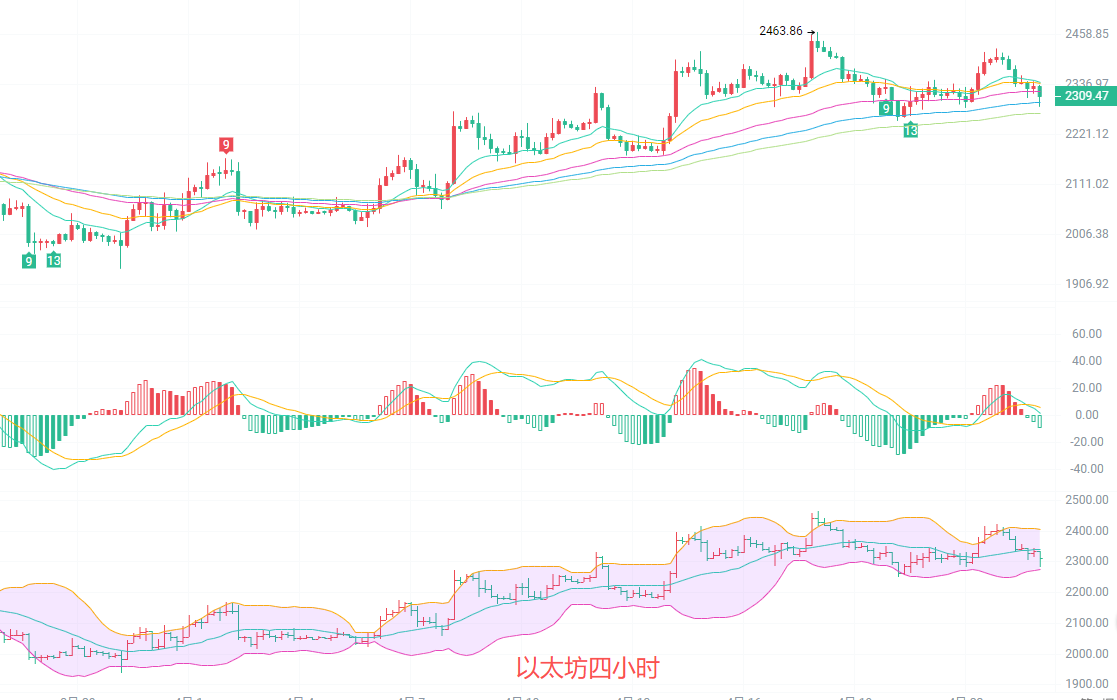
On the 4-hour level, the price of ETH has fallen below the EMA15 and EMA30 moving averages, with the short-term trend weakening from bullish to bearish. The MACD indicator has formed a death cross, and the green bars have started to increase, confirming the top divergence signal and indicating a clear need for short-term pullback. The Bollinger Bands have narrowed, with the price testing the middle line at 2340 and then falling under pressure. The current price is operating below the middle line of the Bollinger Bands, with the lower line at 2273 providing support. The volatile range is further narrowing, and the battle between bulls and bears is concentrated at the 2300 mark. Be cautious of back-and-forth sweeping in short-term operations.
Short-term reference: (Practical data has been updated, please consult the author for details)
From below 2270 to 2300 upward, stop loss at 2250, target at 2340 to 2400
From above 2380 to 2400 downward, stop loss at 2420, target at 2320 to 2300
The essence of trading is risk control, not betting on size. Currently, the direction of Ethereum is unclear; rather than making frequent trades, it is better to wait patiently. Do not let short-term fluctuations affect your mindset; stick to your trading rules to survive in the market for the long term.

Friendly reminder: The above content is exclusively created by the author for the public account. The advertisements at the end of the article and in the comments section have no relation to the author. Please identify carefully, and thank you for reading.
免责声明:本文章仅代表作者个人观点,不代表本平台的立场和观点。本文章仅供信息分享,不构成对任何人的任何投资建议。用户与作者之间的任何争议,与本平台无关。如网页中刊载的文章或图片涉及侵权,请提供相关的权利证明和身份证明发送邮件到support@aicoin.com,本平台相关工作人员将会进行核查。