Crypto Circle Academician: On April 25th, Ethereum continues to see inflows, correlated with Bitcoin's strength. How to navigate this rhythm? Latest market analysis and trading recommendations
The current price of Ethereum is 2320. Is this market making me doze off? The sideways fluctuation feels like boiling frogs in warm water, with bulls and bears pulling back and forth, and there's not even a decent direction! But the more it is like this, the more opportunities are hidden in the details! Don’t get shaken out by the fluctuations, and don’t blindly chase highs or cut losses. Especially for those of us who have been buying north around 2200, today we still break down the dual cycles. We calculate the critical positions for bulls and bears, entry points, and stop-loss lines so we won’t be cut down by the market. Once you read this, you can use it directly!
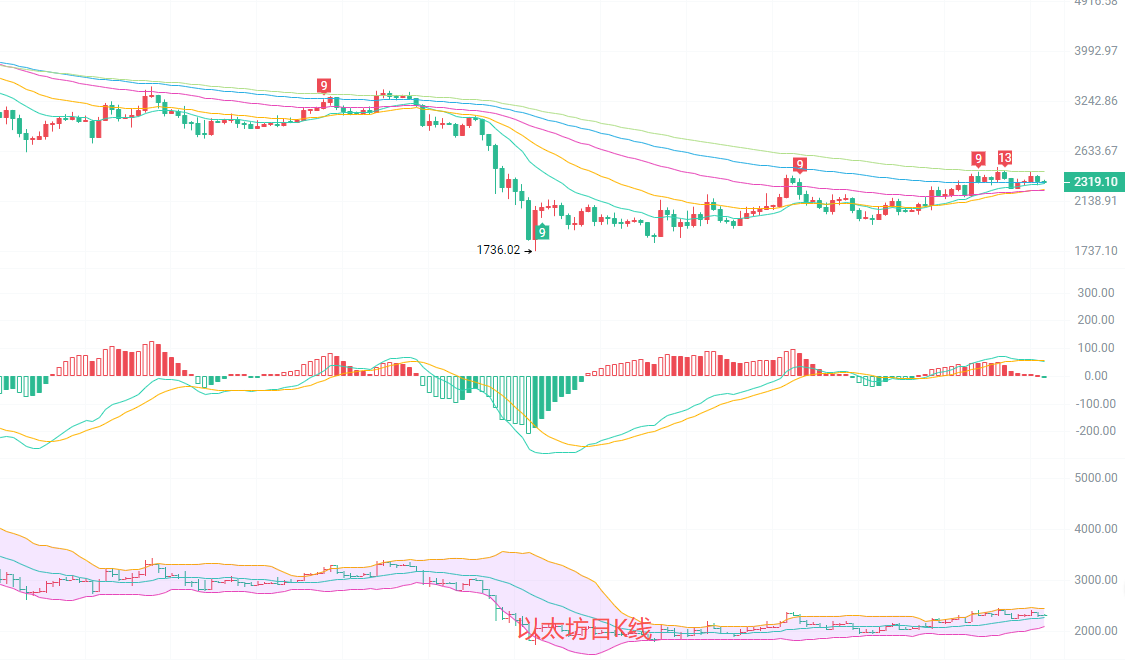
The daily candlestick is currently stabilizing above the EMA30, with moving averages in a bullish alignment but the slope is slowing, and the upward momentum is weakening. In the MACD indicator, the DIF line has crossed below the DEA line, and the red bars are continuously shortening, indicating a weakening of upward strength. The Bollinger Bands are in a contracting state, with prices oscillating near the middle band; the upper band at 2453 and the lower band at 2110 form a short-term range. Overall, the daily line is in a consolidation phase after an increase and has not yet shown a clear trend reversal signal, so the larger trend is still primarily upward.
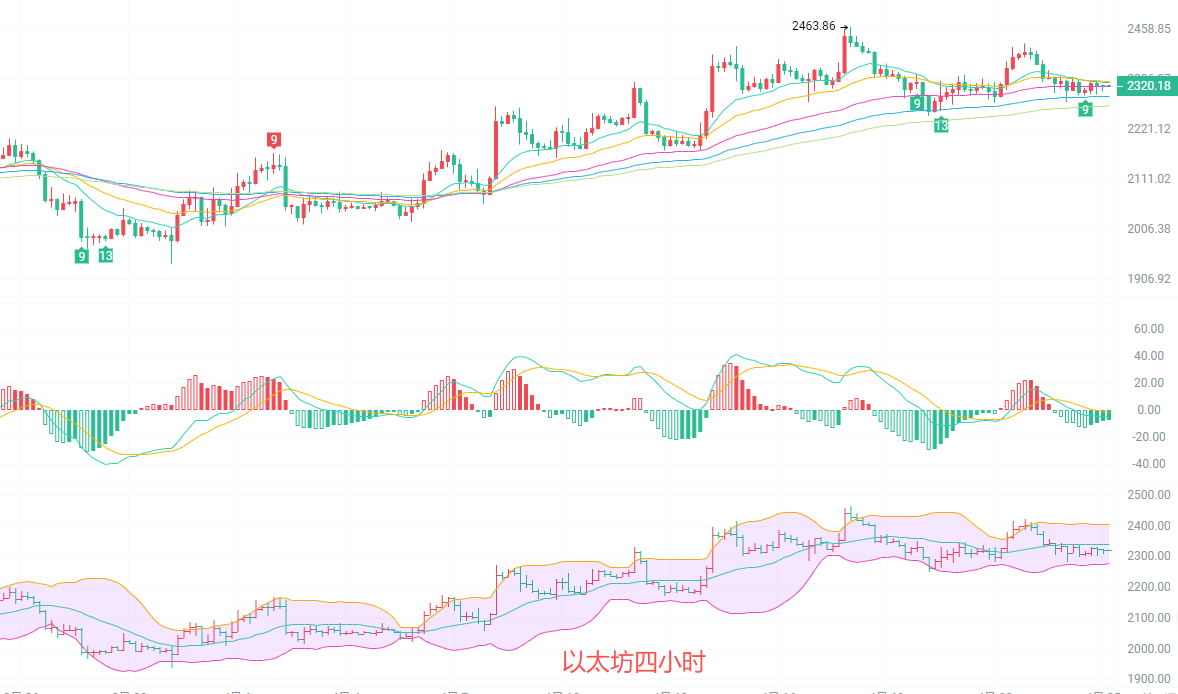
The four-hour candlestick is repeatedly contested near the EMA15 and EMA30 moving averages, with the EMA60 moving average at 2319 almost aligning with the current price, making the short-term direction unclear. The MACD indicator operates below the zero line, with green bars slightly expanding, indicating short-term adjustment pressure. The Bollinger Bands continue to contract, with the upper band at 2406 and the lower band at 2275 forming a narrow oscillation range, and the price is currently hovering near the middle band, lacking effective breakout signals. The short-term is in a balanced state, and given the weekend, I suggest everyone take a break. If you wish to trade short-term, refer to the following:
Short-term reference: (Actual trading data has been updated, please consult the author for details)
Buy between 2270 and 2300, set a stop-loss at 2250, and aim for targets between 2340 and 2400.
Sell between 2350 and 2360, set a stop-loss at 2390, and aim for targets between 2310 and 2290.
Finally, let’s talk about the current market. Don’t think about getting rich quickly. In a fluctuating market, the worst thing is to chase highs and cut losses. Better to miss out than to make mistakes. Keep your position light and always set stop-losses, otherwise, the fluctuations will sweep you out, and your mindset will collapse directly. Patiently wait for a clear breakout signal, whether upward or downward. It’s much better to act once the direction is established than to mess around aimlessly.

Warm reminder: The above content is solely created by the author on the official account. The advertisements at the end of the article and in the comment section are not related to the author. Please distinguish carefully, thank you for reading.
免责声明:本文章仅代表作者个人观点,不代表本平台的立场和观点。本文章仅供信息分享,不构成对任何人的任何投资建议。用户与作者之间的任何争议,与本平台无关。如网页中刊载的文章或图片涉及侵权,请提供相关的权利证明和身份证明发送邮件到support@aicoin.com,本平台相关工作人员将会进行核查。