Waves in the Cryptocurrency Sea: April 25 Ethereum (ETH) Market Analysis Reference:
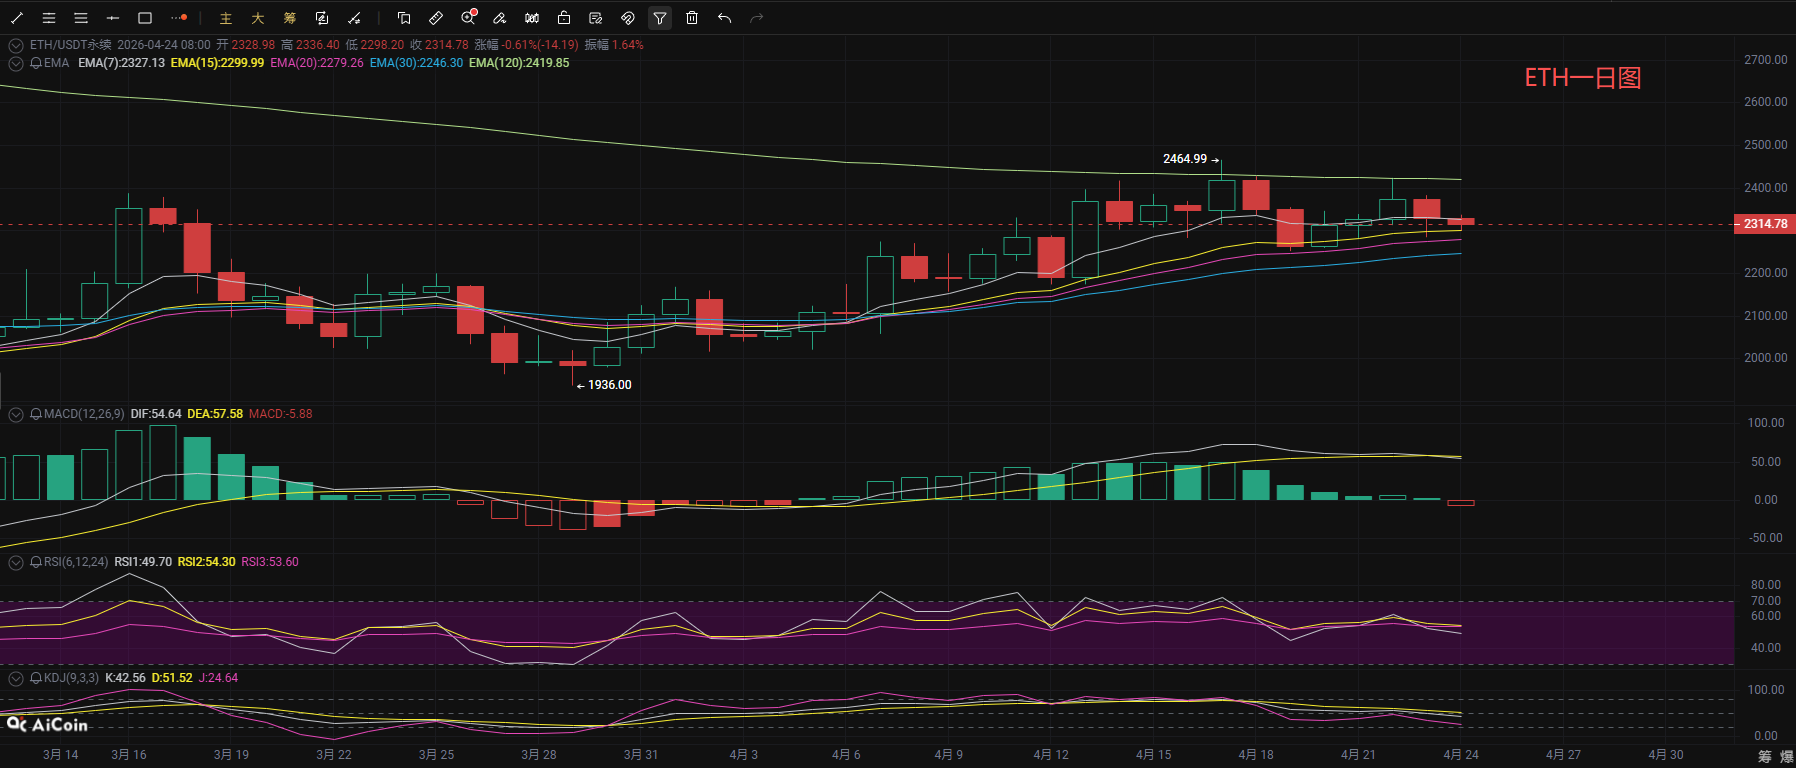
Ethereum maintains a narrow range of oscillation and consolidation, with a contraction in the daily fluctuation space. Observing from the daily chart, the ETH daily line is currently in a high-level consolidation phase after rising, with the price oscillating near the upper area of the middle band of the Bollinger Bands, failing to effectively break through the upper band resistance. The MACD indicator's DIF line and DEA line have formed a death cross, with the histogram turning negative, indicating a gradual increase in bearish momentum. The RSI indicator has fallen back into the neutral range, and the KDJ indicator is diverging downward, overall suggesting a depletion of upward momentum and a high probability of continuing high-level adjustments in the short term. Support below is focused on the middle band of the Bollinger Bands around 2280; if it breaks below this middle band, the adjustment space will further open up.
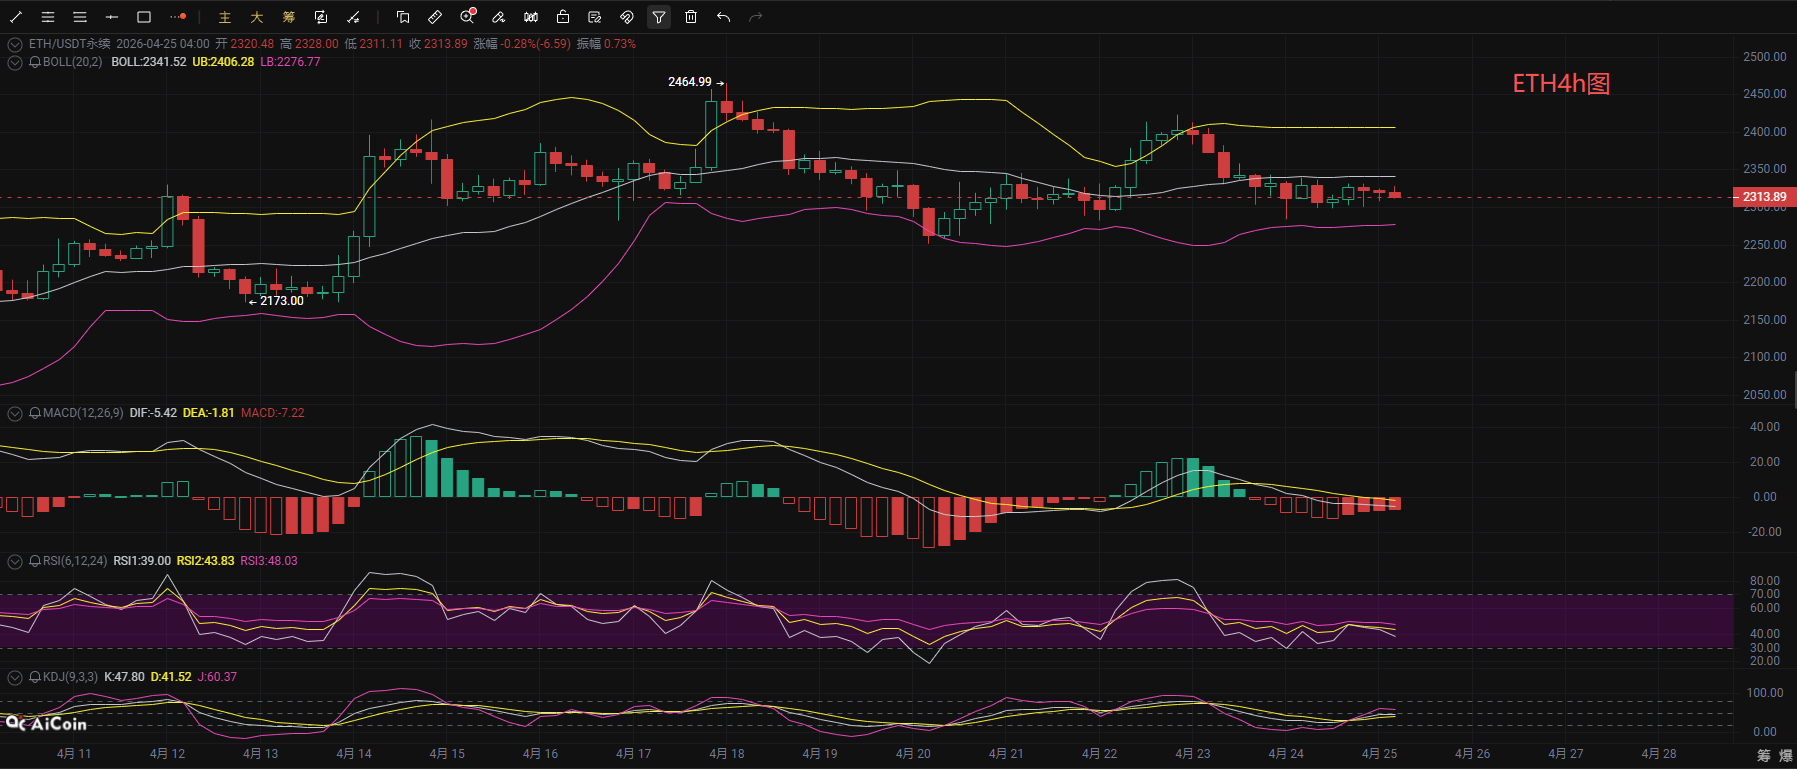
From the short-term hourly chart, the four-hour chart of Ethereum shows a weak oscillation trend. The price is constrained by the EMA moving average, fluctuating narrowly around 2320. The Bollinger Bands channel has narrowed, and the MACD indicator's line crosses below the zero axis, with a slight reduction in the histogram size and a weakening in bearish momentum. The RSI indicator is in a neutral but weak range. Although the KDJ indicator is turning up from a low position, there is insufficient rebound momentum. In the short term, it remains constrained by resistance in the 2340-2350 range, with support below located around 2300-2310. If this support fails, it is highly likely to further explore the position of the lower band of the Bollinger Bands. However, it is expected that the short-term will continue with oscillation and consolidation, and it is recommended to operate within the high and low range during the day, focusing on short-term swing trades while also ensuring defensive measures.
Waves in the Cryptocurrency Sea: April 25 Ethereum Short Line Reference:
Short Order: Sell in the range of 2405-2375, stop loss at 30 points, target at 2355-2305,
Long Order: Buy in the range of 2275-2305, stop loss at 30 points, target at 2325-2375,
[The above analysis and strategy are for reference only. Please bear the risk yourself. The article review and release may have delays, and the strategy may not be timely. Do not act blindly.]

The content of this article is originally shared by [Waves in the Cryptocurrency Sea], and only represents personal opinions. There may be delays in sending the article, and it is for reference only. Do not act blindly! If you want to get more daily real-time trades? Then follow my public account! Here, you can conduct online technical learning and also understand relevant knowledge about exiting positions. I have many years of research experience in the market, focusing on the macro trends in the cryptocurrency circle. Mainly responsible for analyzing and guiding investment operations of BTC, ETH, SOL, BCH, and other cryptocurrencies. Welcome to research and learn together.
免责声明:本文章仅代表作者个人观点,不代表本平台的立场和观点。本文章仅供信息分享,不构成对任何人的任何投资建议。用户与作者之间的任何争议,与本平台无关。如网页中刊载的文章或图片涉及侵权,请提供相关的权利证明和身份证明发送邮件到support@aicoin.com,本平台相关工作人员将会进行核查。