Crypto Waves: 4.27 Cryptocurrency Market Ethereum (ETH) Today's Latest Market Analysis Reference, Information Interpretation
Crypto Waves: 4.27 Ethereum (ETH) Market Analysis Reference:
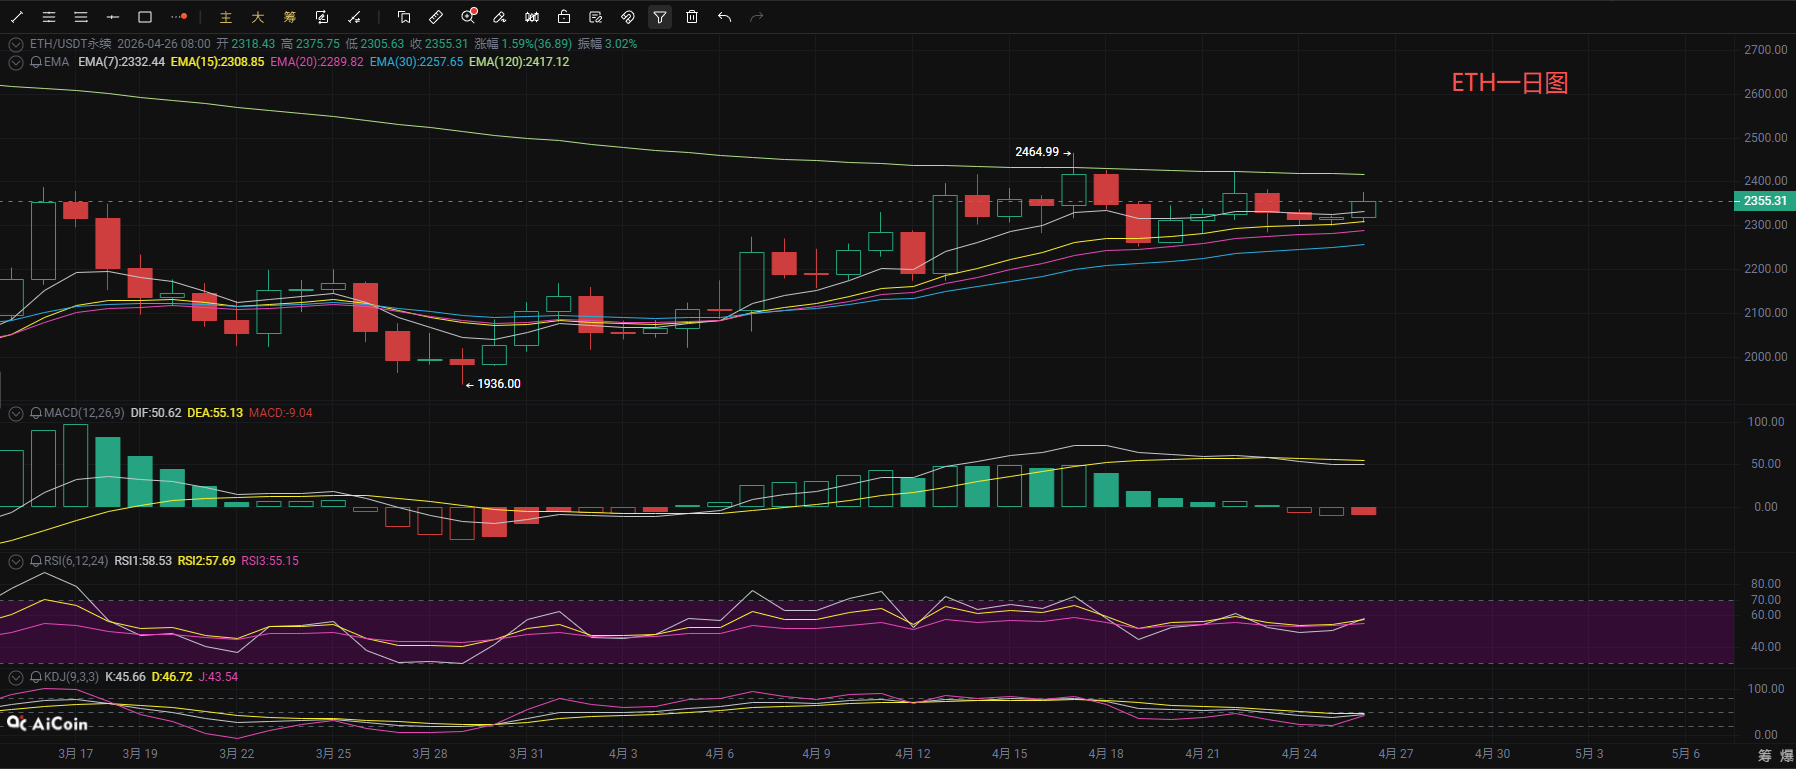
Ethereum maintained a narrow range of fluctuations over the weekend, currently the intraday market is rising with increased trading volume; as of the time of writing, the price is operating around 2355. Observing from the daily chart, the ETH daily line is currently in a high-level consolidation phase, with price running above the middle band of the Bollinger Bands. The middle band and the EMA20 moving average form strong support around 2300, while the upper band and EMA120 constitute an area of pressure. In the MACD indicator, DIF and DEA remain in the bullish territory above the zero axis, indicating that the long-term bullish trend has not completely reversed. The RSI and KDJ indicators are currently oscillating in a neutral range and have not entered the overbought zone, but both are turning upwards, overall in a strong consolidation state. As long as the price does not effectively fall below the support of the Bollinger middle band and EMA20, the daily bullish trend will continue.
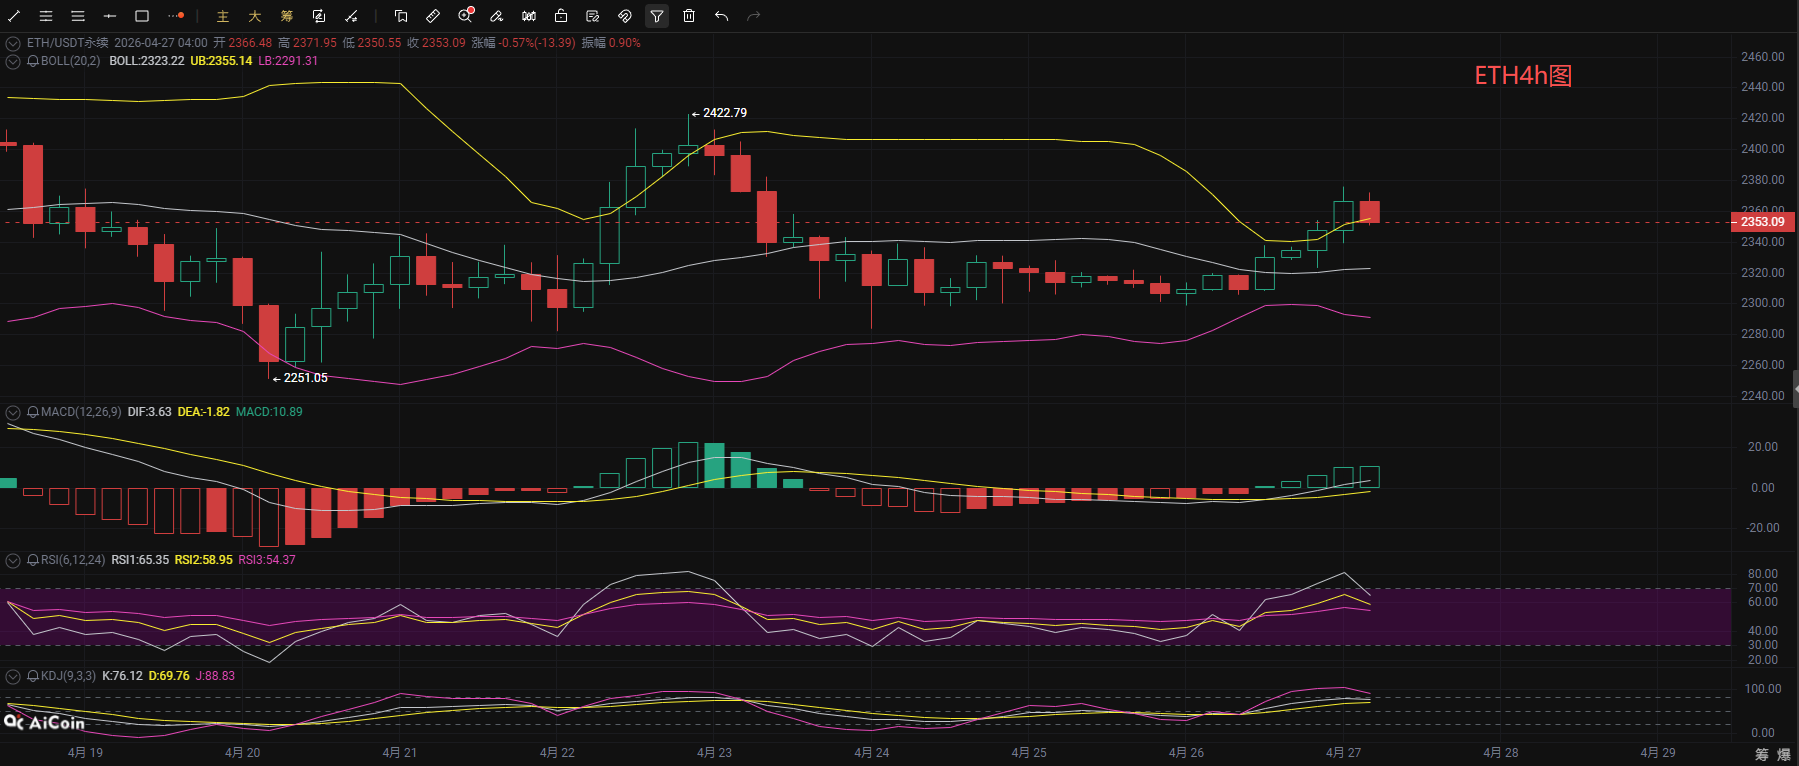
From the short-term hourly chart, the 4-hour level is in an overbought state after a short-term rebound, with price rising continuously and breaking through the upper band of the Bollinger Bands. The Bollinger Bands are expanding upward, indicating a concentrated release of short-term bullish strength. In terms of MACD, after the DIF and DEA completed a golden cross below the zero axis, they quickly crossed above it, with the histogram continuously increasing, showing strong momentum for the short-term rebound. The RSI indicator has entered the overbought zone and is now turning downwards, while the KDJ indicator has also reached a high position, indicating a need for technical corrections in the short-term. The pressure above is concentrated around the previous high point near 2423, while the support level below is focused on the middle band of the Bollinger Bands. If the retracement does not break this support, it is highly likely that the oscillating upward trend will continue. In terms of strategy, it is recommended to sell high and buy low, prioritizing attention to stabilization signals at support levels, and to avoid blindly chasing high prices while ensuring good risk control.
Crypto Waves: 4.27 Ethereum Short-term Reference:
Short Position: Enter short in the 2430-2400 range, stop loss 30 points, target aiming for 2370-2320,
Long Position: Enter long in the 2290-2320 range, stop loss 30 points, target aiming for 2350-2400,
【The above analysis and strategy are for reference only; risks are to be borne by yourself. The article may have delays in review and publication, and strategies may not be timely. Do not operate blindly】

This content is shared by 【Crypto Waves】, representing personal views only. The article may have delays in sending and is for reference only; please do not operate blindly! Want to get more real-time trades daily? Then follow my official account! Here, you can learn online technical trading analysis and get knowledge about exiting positions. I have years of research experience in the market, focusing on the major trends in the cryptocurrency world. Mainly responsible for analyzing and guiding investment operations of BTC, ETH, SOL, BCH, and other cryptocurrencies. Welcome to study and research together.
免责声明:本文章仅代表作者个人观点,不代表本平台的立场和观点。本文章仅供信息分享,不构成对任何人的任何投资建议。用户与作者之间的任何争议,与本平台无关。如网页中刊载的文章或图片涉及侵权,请提供相关的权利证明和身份证明发送邮件到support@aicoin.com,本平台相关工作人员将会进行核查。