Cryptocurrency Circle Expert: Sudden Incident on the Afternoon of April 27! Ethereum Breaks Below 2330, Is it Time to Buy the Dip or Continue Shorting? Latest Market Analysis and Trading Suggestions
The current price of Ethereum is 2318, and this plunge is insane! Just a second ago it was still flaunting above 2400, then suddenly a big bearish candle smashed it down to 2318. Are those who chased the buy totally stunned? Don't panic! I know you all have questions about whether to go long or short next? Should you cut losses? To be honest, this drop was completely within expected adjustments. The high-level consolidation did not break new highs, and the MACD showed a bearish divergence, so a pullback should have been guarded against. Now many people are starting to panic again, but there is no need to act rashly. Either short as per the signals or wait for stabilization to go long; don’t chase highs and panic sell. The cryptocurrency market is all about rhythm, holding positions and all-in betting are the biggest traps. Control your hands, don’t let emotions dictate your actions; staying steady is the long-term strategy.
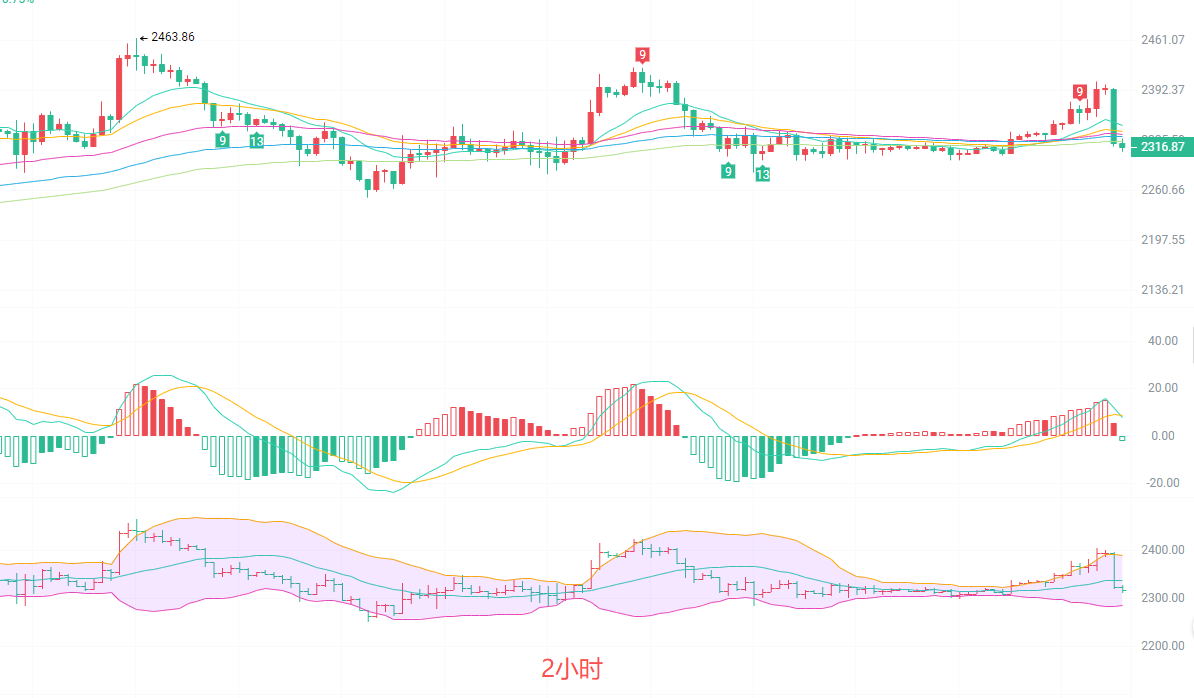
In the afternoon, looking at the two-hour candlestick chart, Ethereum had been steadily moving up along the upper Bollinger Band, hitting a high of 2463. The current candlestick has dropped below the middle Bollinger Band at 2337, closing around 2318, with a clear weakening trend in the short term. The EMA moving average group has started to turn; the 15-period EMA and the 30-period EMA are about to form a death cross. The MACD indicator's red bars are rapidly shrinking, and the DIF is approaching the DEA and is about to cross below, releasing bearish momentum. However, around 2285 there is previous consolidation platform support, and the downward momentum may slow down here, temporarily not supporting a one-sided crash.
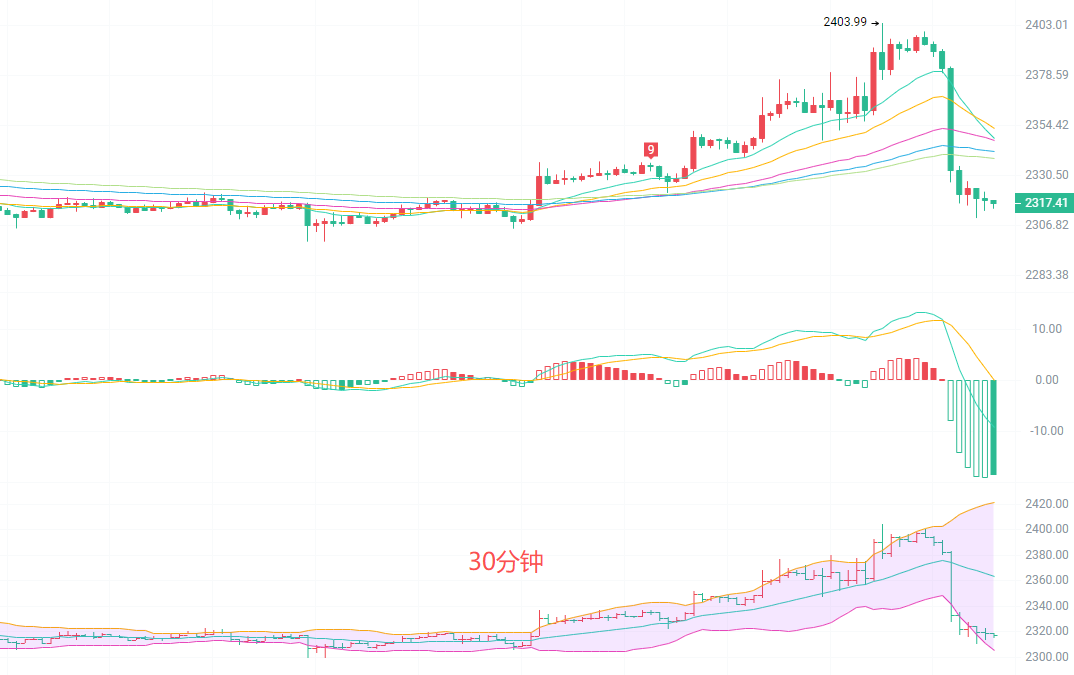
On the 30-minute smaller time frame, Ethereum's adjustment signals are more definite. A large solid bearish candle has directly broken all short-term EMA moving averages, with all from EMA15 to EMA120 lost. The Bollinger Band opening has rapidly expanded, and the price has directly smashed below the lower band, indicating extremely strong short-sell pressure. The MACD indicator crosses below the zero line, with green bars significantly increasing, forming a clear bearish signal. The price is momentarily stabilizing around 2318, but there is already strong resistance in the upper range of 2335-2340 from EMA30 and EMA60, and any rebound is likely to be an opportunity for a second short position. Support is at the two levels of 2310 and 2300, and the major market movement for the day has already completed; what remains is a horizontal consolidation repair phase of twenty to thirty points.
Short-term Reference: (Real-time data has been updated, please consult the author for details)
Long position from 2300 to 2305, stop loss at 2280, target at 2325 to 2335
Short position from 2335 to 2340, stop loss at 2355, target at 2310 to 2300

Reminder: The above content is only created by the author on the official account; the advertisements at the end of the article and in the comments section are unrelated to the author. Please be cautious in discerning, thank you for reading.
免责声明:本文章仅代表作者个人观点,不代表本平台的立场和观点。本文章仅供信息分享,不构成对任何人的任何投资建议。用户与作者之间的任何争议,与本平台无关。如网页中刊载的文章或图片涉及侵权,请提供相关的权利证明和身份证明发送邮件到support@aicoin.com,本平台相关工作人员将会进行核查。