K line is the most basic price presentation method in technical analysis. It can transform the tedious opening, closing, highest, and lowest prices into an intuitive chart, allowing you to see market price fluctuations at a glance.


Each K line contains four core data: the opening price is the starting price for the corresponding period, the closing price is the price at the end of the period, the highest price is the highest transaction price within the period, and the lowest price is the lowest transaction price within the period.
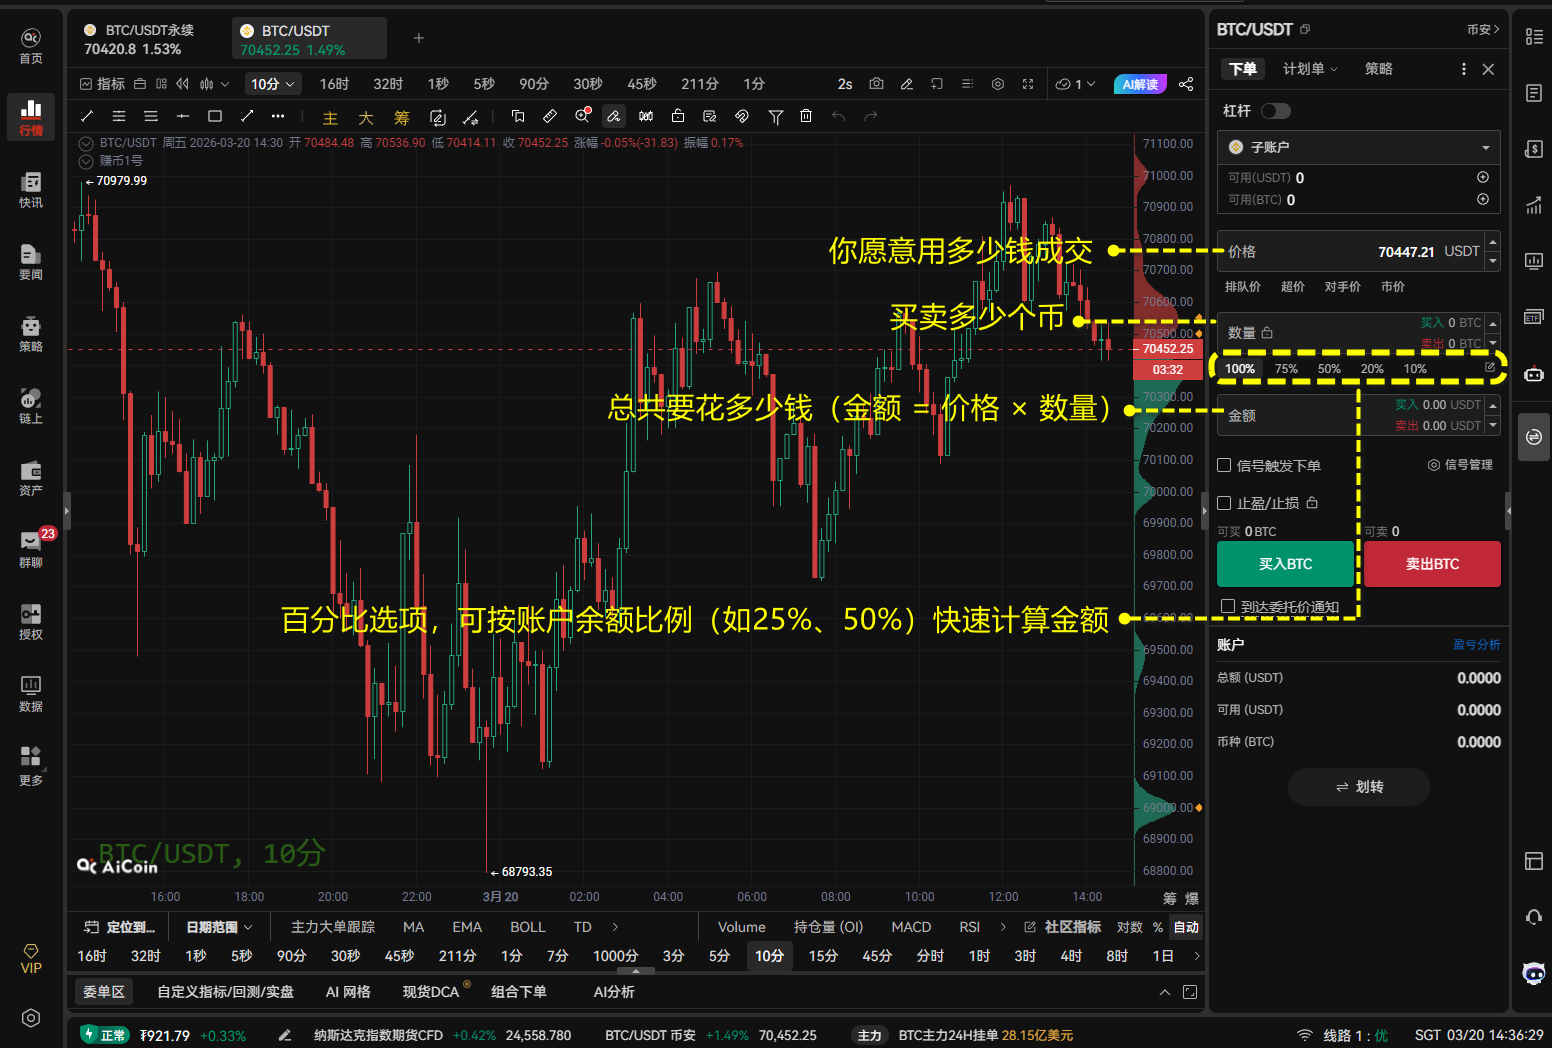
To understand K line, first grasp the concept of period. The period is the time length represented by each K line, which can be switched to different intervals such as 1 second, 1 minute, 45 minutes, 1 hour, 1 day, 1 month, etc. Different periods correspond to different market analysis dimensions. When observing the market, first identify the period to accurately read the signals.
The structure of the K line is easy to distinguish: the rectangle in the middle is the body, the thin line above the body is the upper shadow, corresponding to the highest price within the period; the thin line below the body is the lower shadow, corresponding to the lowest price within the period. The market uses green for rise and red for fall: a green candlestick represents a closing price higher than the opening price, indicating a rise; a red candlestick represents a closing price lower than the opening price, indicating a fall.
K lines can be divided into three categories based on the period to meet different analysis needs:
- Short period: 1 minute, 1 hour, suitable for capturing short-term market fluctuations
- Medium period: 1 day, 1 week, used to judge medium-term trends
- Long period: 1 month and above, to grasp the overall market direction
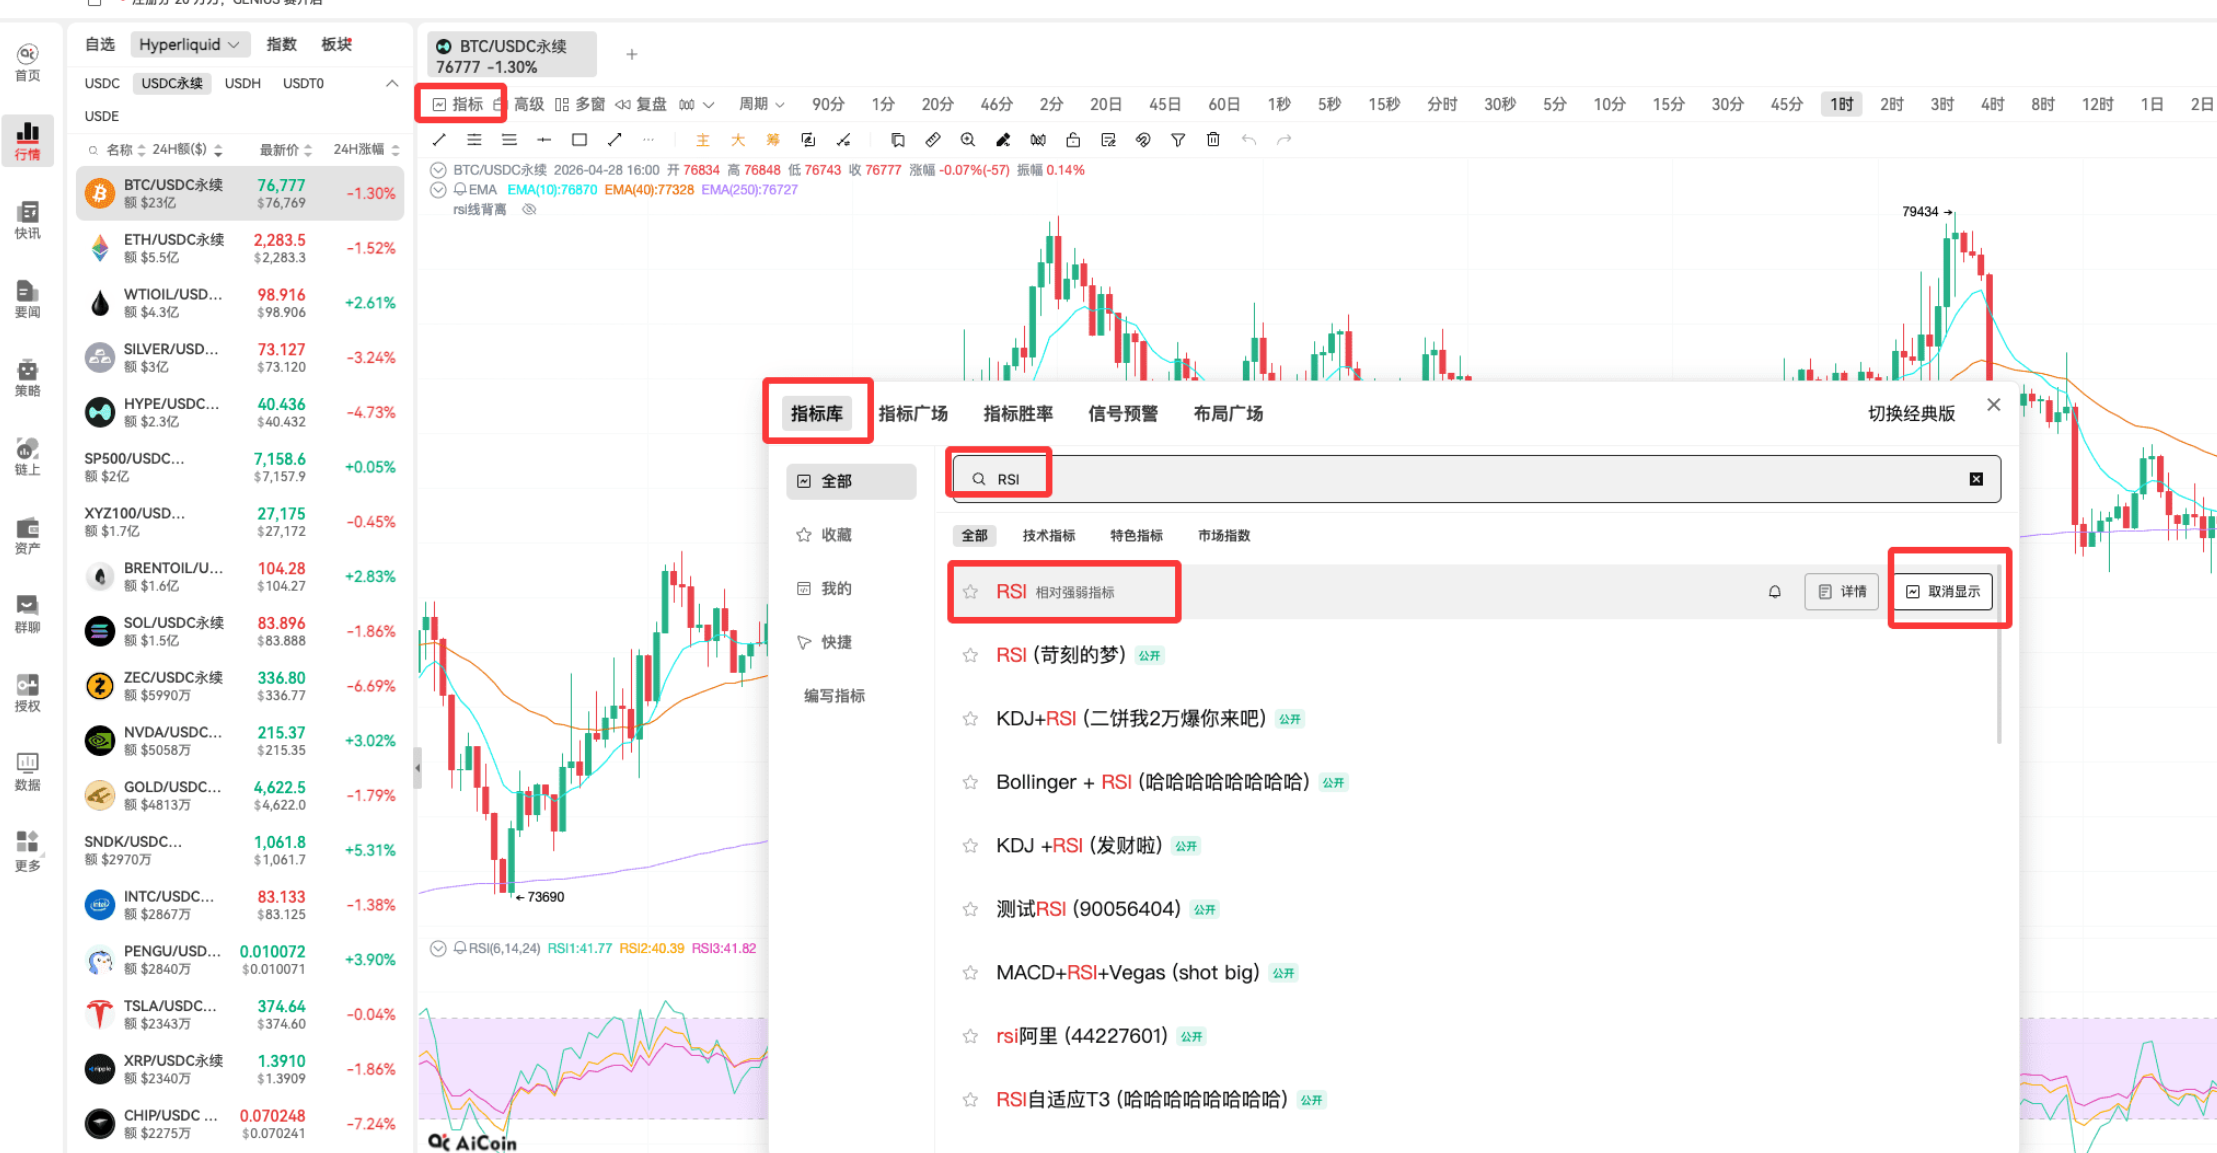
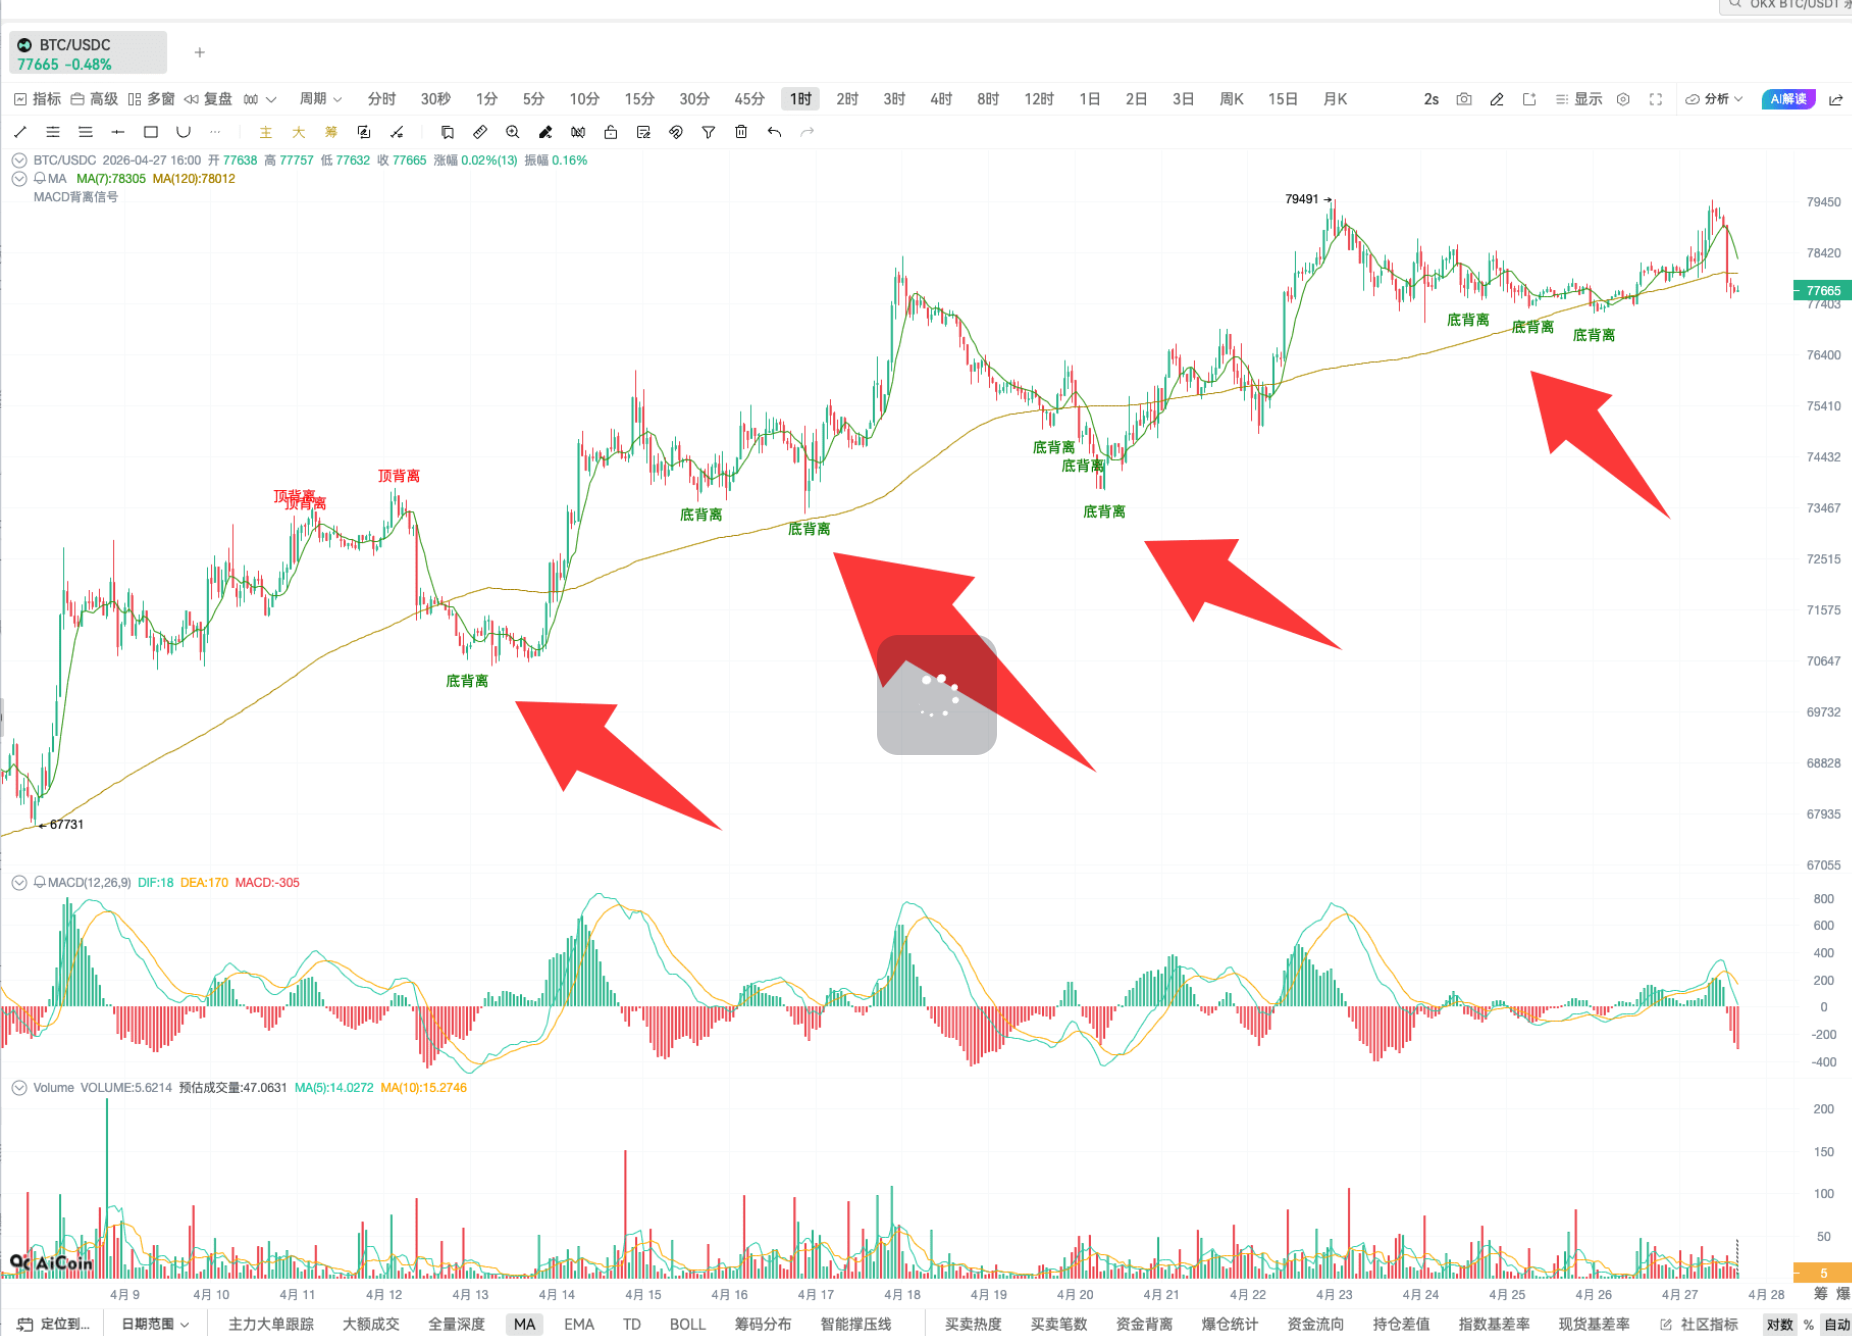
K lines are the core foundation of all technical analysis. Common indicators such as moving averages, EMA, MACD, etc., are all based on K line patterns. Learning K line analysis logic can be applied in various investment markets.
Next are the most commonly used K line reversal patterns in practice, which are simple and easy to identify, serving as key signals for judging market trends.


Morning Star appears at the end of a downtrend, with the pattern being a consecutive decline + a middle doji K line + a subsequent bullish line, where the doji has longer upper and lower shadows. This is a signal for market rebound and bottom hunting, indicating a high likelihood of reversal from a downtrend to an uptrend. The lower the previous low, the more accurate the signal.

Evening Star is the opposite of the Morning Star, appearing at the peak of an uptrend, with the pattern being a consecutive rise + a middle doji K line + a subsequent bearish line. This signals that the market is peaking and likely to decline, indicating a high probability of reversal to weakness.
Bullish Engulfing is a large bullish line whose body completely engulfs the previous bearish line, indicating strong buying power, with bulls thoroughly suppressing bears, making it a clear signal to go long. The larger the bullish line body, the stronger the reversal signal.

Bearish Engulfing is a large bearish line whose body completely engulfs the previous bullish line, often appearing at the top of an uptrend, indicating that bearish power dominates the market, making it a clear signal to go short.

In practice, remember: a single K line pattern should not be used as the basis for trading decisions. It should be combined with multi-period verification, support and resistance confirmations; the accuracy of judgment will significantly increase when multiple signals overlap. For example, when a Morning Star appears at a previous low, or an Evening Star appears at a previous high, the signal's reference value is higher.
The K line logic for on-chain trading is completely consistent with mainstream markets. Learning K line analysis not only allows you to understand the trends of mainstream cryptocurrencies but also easily interpret the price fluctuations of on-chain tokens, making it the core first step in technical analysis.
This article represents the author's personal views and does not reflect the position or views of this platform. This article is for information sharing only and does not constitute investment advice to anyone.
免责声明:本文章仅代表作者个人观点,不代表本平台的立场和观点。本文章仅供信息分享,不构成对任何人的任何投资建议。用户与作者之间的任何争议,与本平台无关。如网页中刊载的文章或图片涉及侵权,请提供相关的权利证明和身份证明发送邮件到support@aicoin.com,本平台相关工作人员将会进行核查。