Dear friends, I am Sister Qinglan. Early this morning, the market was a bit stunned by two heavy news. First, Musk publicly stated in court that most cryptocurrencies are scams, which directly affected market sentiment and led to panic selling in the short term. Immediately after, there was a net outflow of 1725 BTC from the Bitcoin ETF in the U.S. within a single day, and over 40,000 ETH flowed out of the Ethereum ETF. The continuous exit of institutional funds has worsened the situation for the bulls. The combination of these two bearish factors, along with data showing that $373 million was liquidated across the network within 24 hours and heavy losses in long positions, has clearly put pressure on the market in the short term. But remember, opportunities often lie within panic; let's first examine the current situation with data.
Current Price and Time
The current time is May 1st, 10:01, and the Bitcoin price is 76688 USDT. The 24-hour price change is 0.75%, but the fear and greed index is only 29, placing it in the fear zone. At this position, the battle between bulls and bears is intense, but the direction may be right before us.
Multi-Cycle Status Overview
On the daily level, MA5 is at 76505, MA10 is at 77268, and MA30 is at 74017, with the price oscillating between MA5 and MA10. MACD's DIF is at 1452, DEA at 1727, and the histogram is at -275, indicating that bearish momentum is still being released, but the histogram is shortening, showing signs of decay. RSI is at 48.58, neutral and weak. Overall, the daily line is in a recovery stage after a decline, but a reversal has not been confirmed.
On the 4-hour level, MA5 is at 76396, MA10 is at 76133, and MA30 is at 76945, with the price above MA5 and MA10, but below MA30. MACD's DIF is at -252, DEA at -312, and the histogram is at 60.42, showing that bearish momentum is weakening, with signs of a golden cross between the fast and slow lines. RSI is at 53.67, neutral. There are signs of stabilization and rebound on the 4-hour chart, but there is obvious pressure from MA30 above.
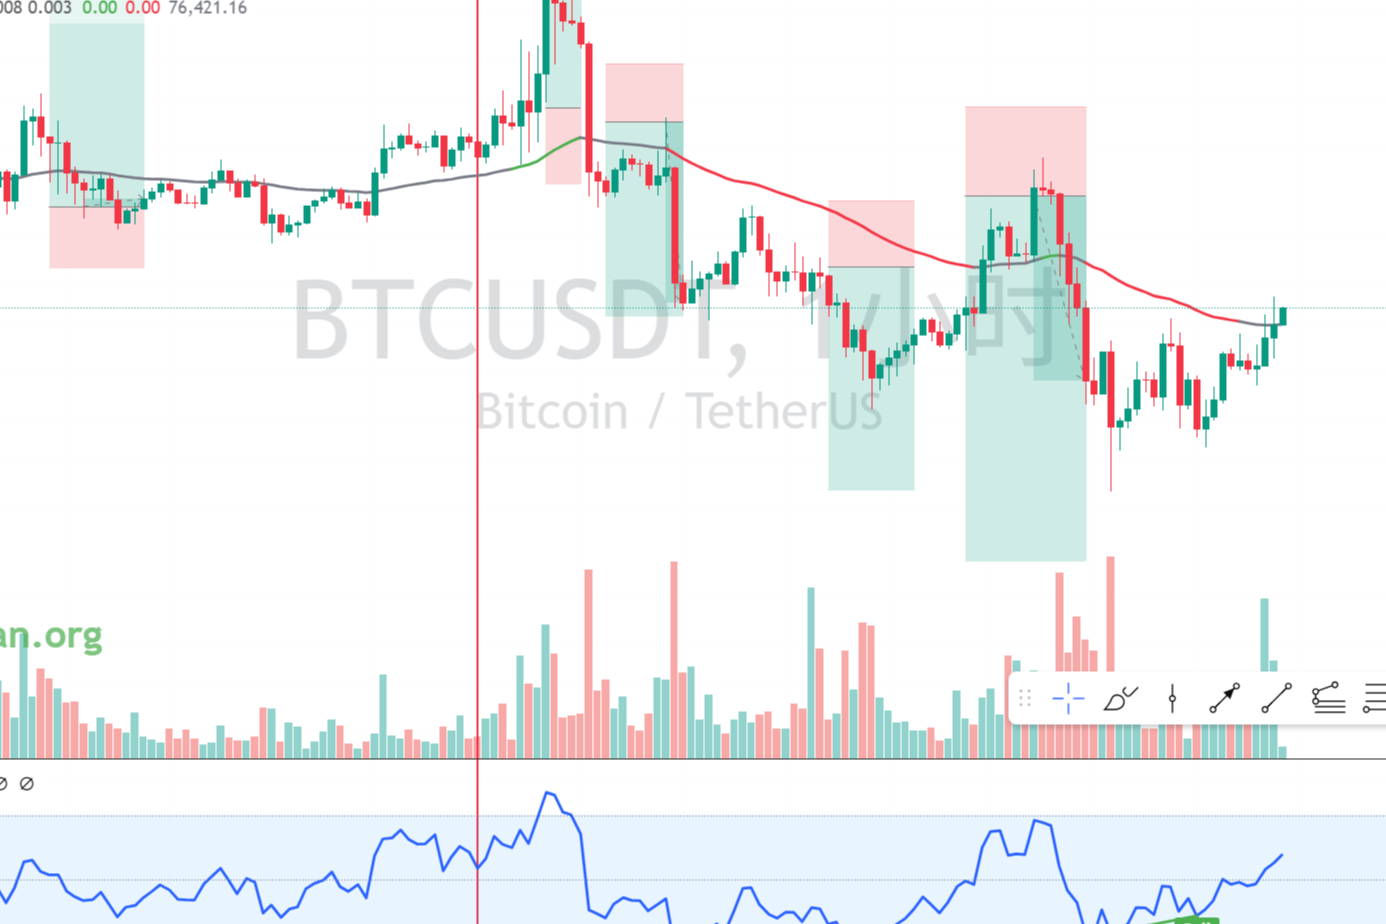
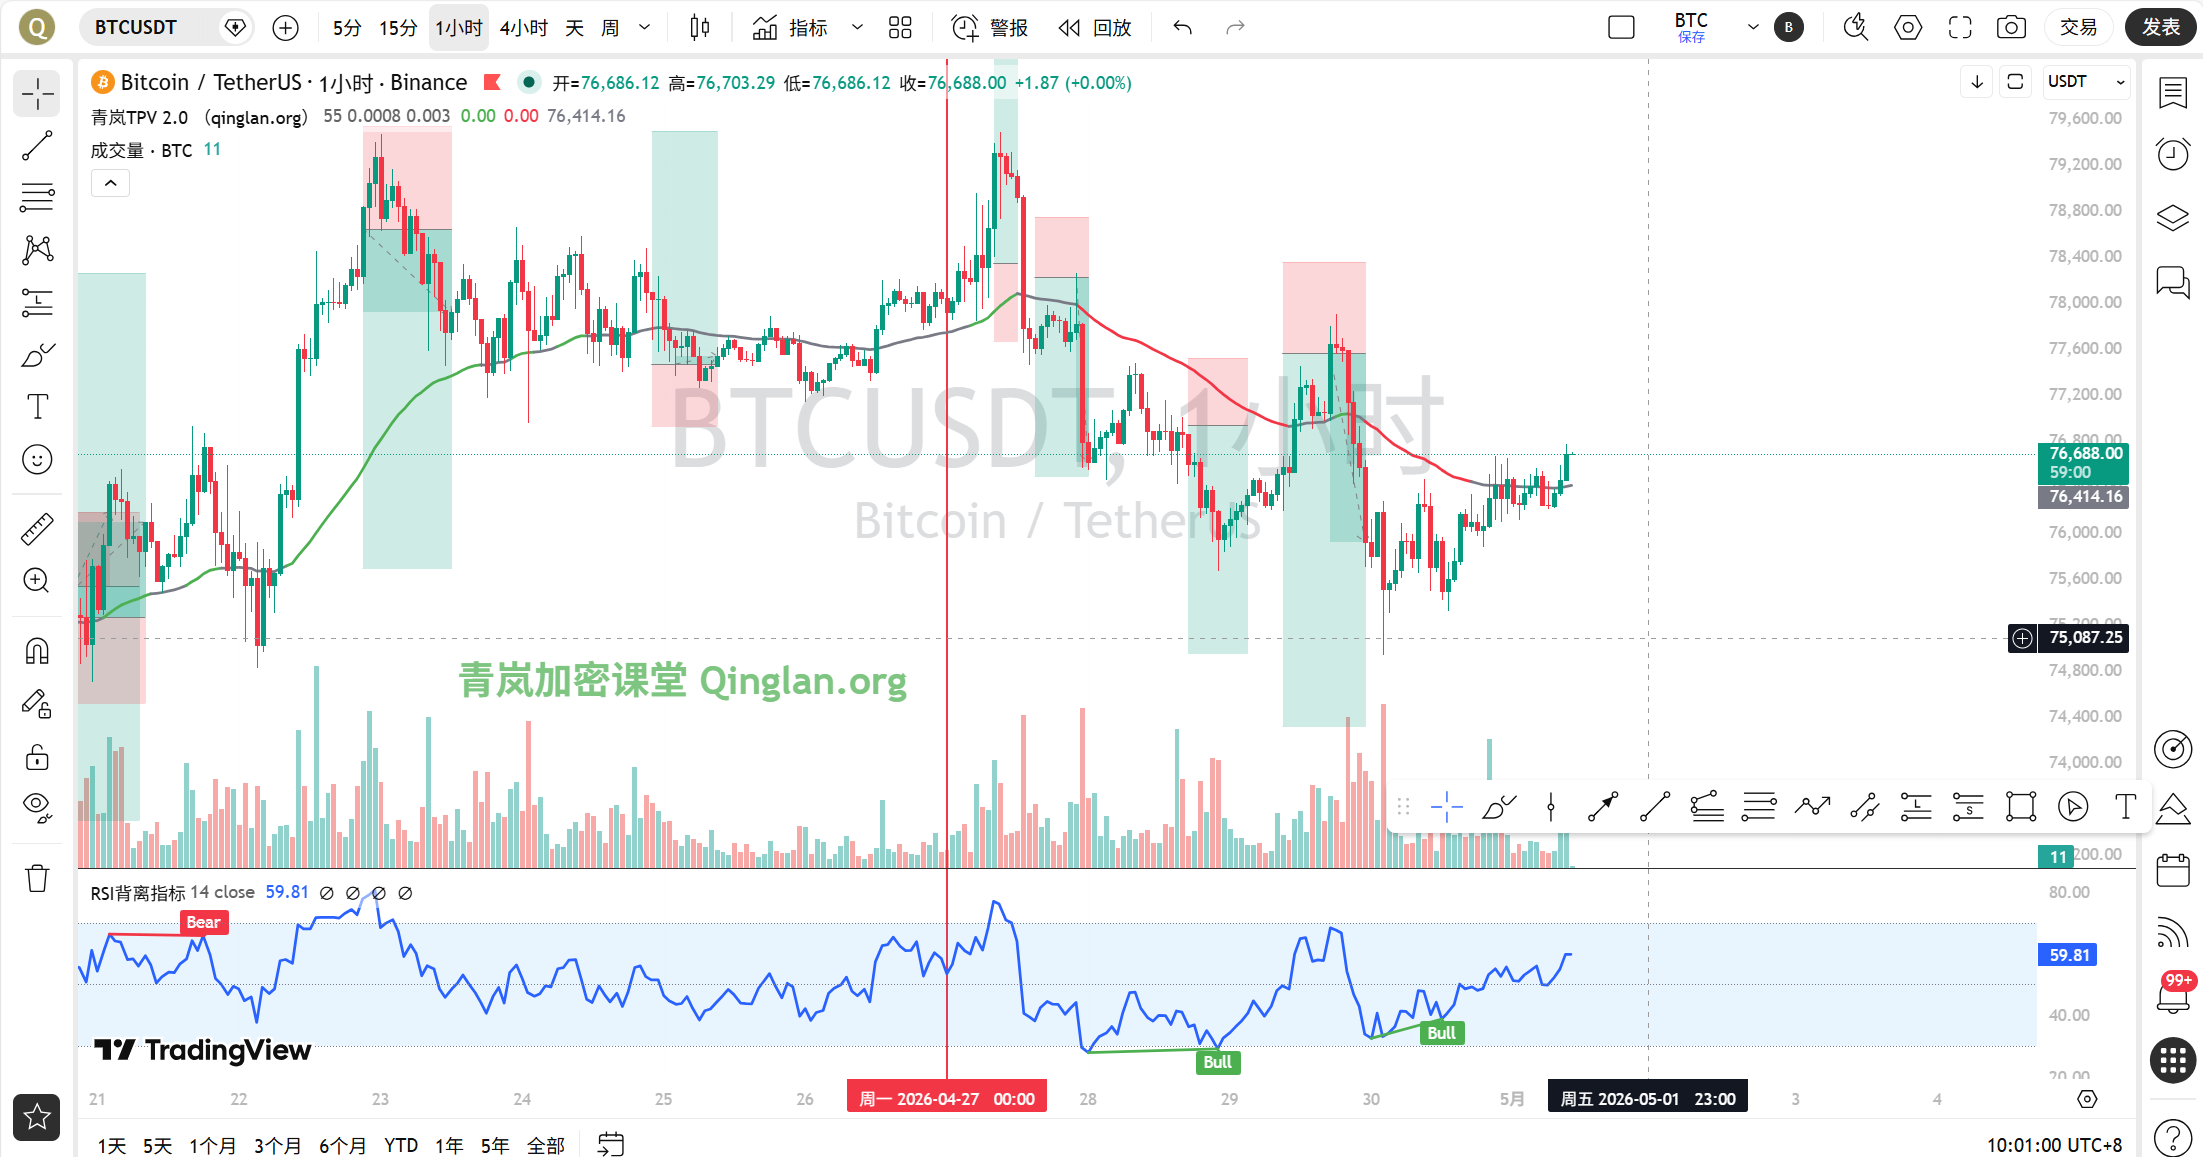
On the 1-hour level, MA5 is at 76483, MA10 at 76416, and MA30 at 76164, with the price running above the moving averages. MACD's DIF is at 95.18, DEA at 44, and the histogram at 51.18, indicating sustained bullish momentum. RSI is at 62.04, slightly strong. The 1-hour EMA55 is at 76362, and the current price is 76688, about 0.43% above EMA55, favoring bulls in the short term.
On the 15-minute level, MA5 is at 76618, MA10 at 76542, and MA30 at 76443, with the price above the moving averages. MACD’s DIF is at 75.21, DEA at 46.14, and the histogram at 29.07, indicating that bullish momentum is still present. RSI is at 73.49, close to the overbought area, indicating a need for short-term correction.
TPV Signal Verification
According to the Qinglan TPV system, we use 1-hour EMA55 as the boundary between long and short positions. The current price is 76688, which is above the EMA55 at 76362, indicating a bullish trend area. However, oscillation supporting data shows that out of the last 8 one-hour candlesticks, the closing price was greater than EMA55 5 times, crossed through 2 times, and the price is 0.43% from EMA55, meeting the oscillation determination threshold. This means that although the price is above EMA55, the market is not entirely bullish, but rather in a fluctuating bullish pattern.
Long Condition Verification: The price has continuously closed above EMA55 for 2 consecutive one-hour candlesticks, satisfying condition 1. Regarding support and stabilization, there are signs of bottom formation on the 4-hour level, but the 1-hour level has not shown significant long lower shadows or volume stagnation, partially satisfying condition 2. In terms of declining momentum exhaustion, MACD bars have shrunk for 2 consecutive cycles, and RSI has risen from below 30 to 62, satisfying condition 3. Overall, the conditions for going long are partially established, but under oscillation attributes, the risk of chasing long positions is relatively high.
Short Condition Verification: The price has not been pressured below EMA55, so condition 1 is not satisfied, thus no short positions are taken.
Handling Oscillating Market: Currently meeting oscillation criteria, do not actively go long or short, only provide range trading ideas.
On-chain/Fundamentals
On-chain data indicates a fear and greed index of 29, with market sentiment extremely fearful; this is often a signal of a bottom area, but needs to be confirmed with price structure. Funding rates remain negative, mainstream CEX and DEX show a completely bearish sentiment, dominated by short sellers. However, note that when funding rates are deeply negative, it can easily trigger short squeezes, and rebounds may suddenly occur. With significant outflows from ETFs and cautious institutional attitudes, short-term upward space might be compressed. Overall, on-chain data leans bearish, but fear sentiment may be brewing for a reversal.
Key Defense and Attack Levels
Upper Pressure Level: The first pressure level is at 77000, an area of resonance with the 4-hour MA30 and the integer point; breaking through it will open up upward space. The second pressure level is at 78000, near the daily MA10, marking the mid-term bullish-bearish watershed.
Lower Support Level: The first support level is at 76300-76400, which is the area of the 1-hour EMA55 and 4-hour MA5; dropping below this would weaken the bullish trend. The second support level is at 75500, near the previous low, which is the last defense line for short-term bulls.
Trading Ideas
Currently in a fluctuating pattern, do not chase up or down, mainly focus on high selling and low buying within the range.
Direction: Fluctuating bullish, but only long on corrections, do not chase highs.
Entry Conditions: If the price pulls back to the 76300-76400 area and a 15-minute bullish engulfing or long lower shadow stabilization signal appears, can try a light long position. If the price directly breaks through 77000 and stabilizes, can wait for a pullback confirmation to chase long.
Stop Loss Level: Set the stop loss for long positions below 76000; a breach would indicate a breakdown of the bullish structure, requiring withdrawal and observation.
Target Level: First target at 77000, second target at 78000. If the price is blocked around 77000 and a top formation occurs, consider reversing to short with a target of 76300.
Risk Warning
In a fluctuating market, prices may repeatedly cross EMA55, maintain strict stop losses to avoid holding unprofitable positions. If unanticipated negative news causes a drop below 75500, the bullish logic fails, and observation should be adopted.
Follow Qinglan’s Crypto Classroom, let’s grasp more trading opportunities together! Get accurate entry: www.qinglan.org
📊 Qinglan TPV Trading Strategy Backtesting Reference
🕒 Last Backtest Time 05-01 07:00:02
Total Analysis: 1216 Backtests: 1210 Accuracy Rate: 70.2% (849/1210)
免责声明:本文章仅代表作者个人观点,不代表本平台的立场和观点。本文章仅供信息分享,不构成对任何人的任何投资建议。用户与作者之间的任何争议,与本平台无关。如网页中刊载的文章或图片涉及侵权,请提供相关的权利证明和身份证明发送邮件到support@aicoin.com,本平台相关工作人员将会进行核查。