Good morning, friends, I am Sister Qinglan. For today, May 3rd market situation, we must start from two heavy news updates. The first is a warning from CryptoQuant, indicating that Bitcoin's rise in April was mainly driven by speculation, lacking spot support, and the risk of a pullback is increasing. This directly points out the core contradiction in the current market: prices are pushed up but the foundation is unstable. The second report is that Trump threatens to resume airstrikes against Iran, with the shadow of escalating geopolitical conflict once again cast over the market, increasing the risk-averse sentiment, which places short-term pressure on risk assets like BTC. These two pieces of negative news combined set a cautious tone for today's market. In Qinglan's Crypto Classroom, we consistently emphasize that news is the catalyst for market movements, but the technical aspect is our ultimate basis for strategy formulation. Now, let's let the data speak.
Current Price and Time
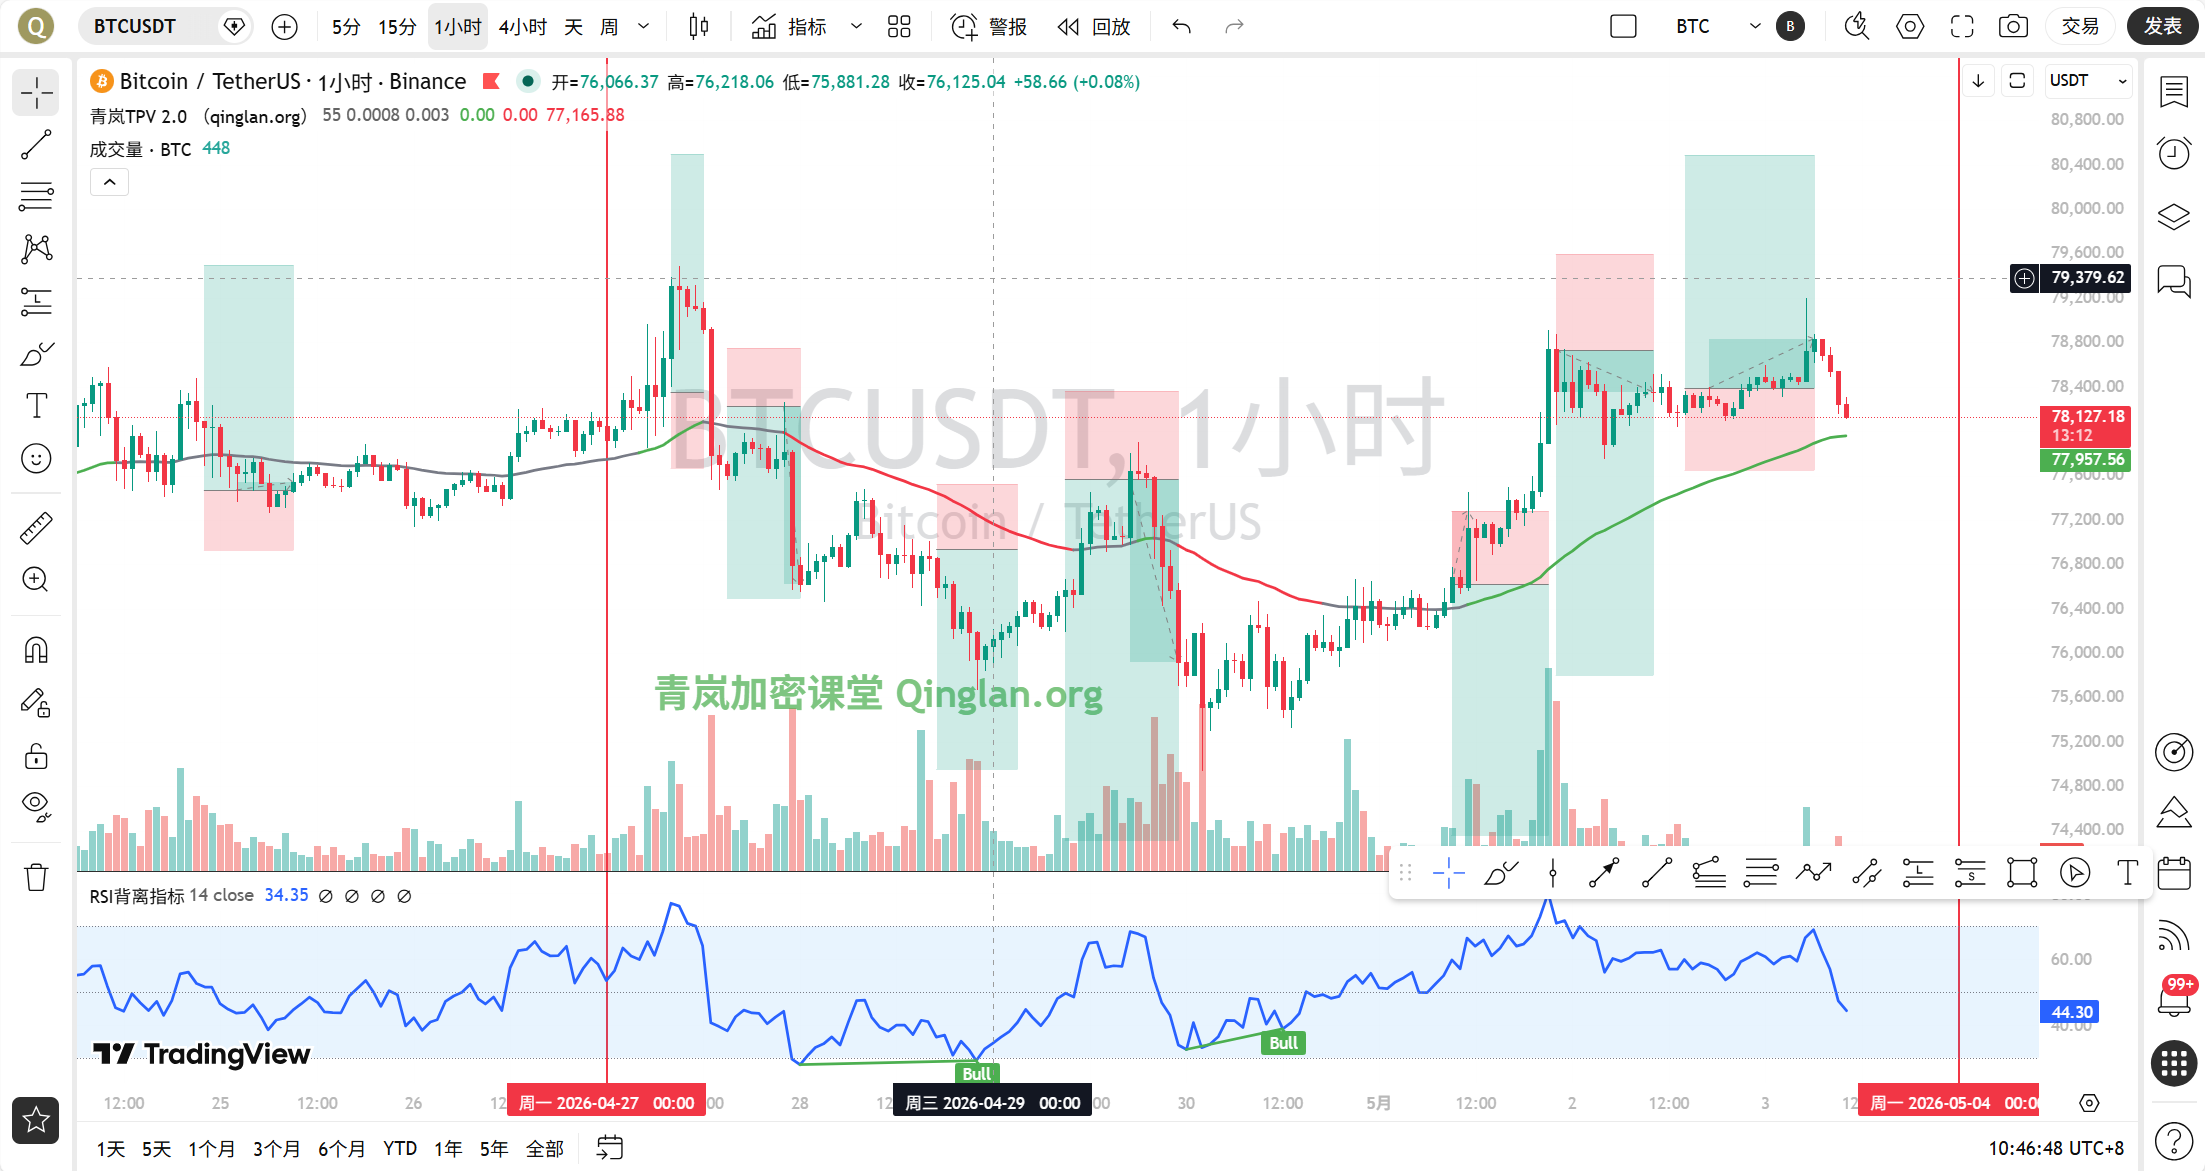
The current time is 10:44 AM on May 3rd, the latest quote for Bitcoin is 78123 USDT. The increase within 24 hours is only 0.58%, and the market overall shows a retreat after a high-level fluctuation. The Fear and Greed Index is at 47, which is in the neutral zone, indicating that market sentiment is neither extreme nor driven by obvious greed. At this position, both bulls and bears are waiting for a clear signal for a breakthrough.
Multi-Cycle Status Overview
Let us first look at the long-term cycle. On the daily level, the price is firmly above the MA5 and MA30 moving averages, with MA5 at 77433 and MA30 at 74833, showing a sound bullish arrangement. However, the MACD histogram shows -108.84, and the DIF line is below the DEA line, indicating that the upward momentum at the daily level has started to diminish, signaling stagnation at high levels. The RSI is at 66.82, in a neutral to strong area, not yet entering overbought territory, but also not cheap.
Switching to the 4-hour cycle, the situation is clearer. The price is entangled near MA5 and MA10, with MA5 at 78385 and MA10 at 78358, and the short-term moving averages are almost flat. In terms of MACD, the DIF line is at 430.14, the DEA line is at 322.69, and the histogram is at 107.46; although it is still positive, the length of the bars compared to previous highs has noticeably shortened, indicating that the bullish momentum at the 4-hour level is weakening. The RSI is at 71.82, having entered the slightly overbought area, suggesting a potential need for a short-term pullback.
Now looking at the 1-hour cycle, which is our core operational cycle. The current price is 78123, while the 1-hour EMA55 is at 77887, indicating the price is operating above EMA55. However, note that the MA5 and MA10 have formed a death cross, with MA5 at 78485 and MA10 at 78494, and the price has dropped below these two short-term moving averages. The MACD histogram has been negative, with the DIF line below the DEA line, indicating that bearish momentum is being released. The RSI is at 47.21, in a neutral to weak area.
Finally, the 15-minute cycle, which is the battleground for ultrashort-term operations. The price has dropped below all three moving averages, with MA5 at 78181, MA10 at 78335, and MA30 at 78512, demonstrating a bearish arrangement. The MACD histogram continues to be negative, with the DIF line below the DEA line. Most notably, the RSI has fallen to 15.34, entering an extremely oversold area. This usually indicates a demand for a technical rebound in the short term, but the strength and duration of the rebound need to be observed.
TPV Signal Verification
Now we enter the core judgment of the Qinglan TPV system. We use the 1-hour EMA55 as the dividing line between bulls and bears; the current EMA55 is at 77887, and the price of 78123 is above it. According to the oscillation auxiliary data, in the past 8 1-hour K-lines, the closing price was greater than EMA55 8 times, with 0 crossings, and the price distance from EMA55 is 0.30%. This does not meet the threshold for oscillatory market conditions, indicating that the market is in a one-sided trend. But the question is, is this one-sided trend upward or downward?
First, we verify the long conditions. Condition one, the price firmly stands above the 1-hour EMA55. The current price is above EMA55, but we need to see two consecutive 1-hour K-lines closing above EMA55. From the data, the closing prices of the last 8 K-lines were all above EMA55, thus meeting this condition. Condition two, support stabilizes. The current price is rebounding from around 78123, but has not formed a clear long lower shadow or bottoming structure. Condition three, the downward momentum exhausts. The MACD histogram has been negative, and the RSI in the 15-minute cycle is extremely oversold, but the MACD bars in the 1-hour cycle are still shortening and have not yet shown a clear exhaustion signal. Overall, some conditions for going long are met, but the support and momentum exhaustion signals are not strong enough.
Now verifying the short conditions. Condition one, price is under pressure below the 1-hour EMA55. The current price is above EMA55, so this condition is not satisfied. Condition two, resistance is encountered. The price retraced from around 78500 in the 1-hour cycle, forming a short-term upper shadow but has not yet formed a clear top structure. Condition three, rebound is weak. The MACD histogram has been negative, and the RSI has fallen from 47.21, indicating insufficient rebound strength. But the core condition is that the price must be below EMA55, so the short conditions are also currently not established.
Therefore, the current TPV system signals that the market is in a bullish trend area but with short-term momentum exhaustion and a pullback risk. We are at a critical point between trend continuation and trend reversal. In Qinglan's Crypto Classroom, we repeatedly emphasize that critical points are risk points, at this time it is not advisable to blindly chase long or buy the dip, and we need to wait for more clear signals.
On-chain and Capital Flow
On-chain data indicates that the Fear and Greed Index is at 47, neutral. Bitcoin's market share is at 58.48%, still very high, suggesting funds are still rotating within Bitcoin and not flowing significantly into altcoins. On the news front, Bitcoin ETFs have seen a net inflow of 162.8 million US dollars this week, with institutional funds continuously flowing in, which is a long-term positive. However, the crypto financing amount in April dropped by 74%, hitting a 14-month low, indicating insufficient confidence in the primary market. At the same time, a giant whale accumulated a 90 million dollar long position, and the liquidation price was exposed, highlighting that the risk of liquidation under high leverage cannot be ignored. These signals interweave, indicating that short-term market sentiment is weak and the battle between bulls and bears is intense.
Key Defense and Attack Levels
The most important support level currently is the 1-hour EMA55, at 77887. If the price breaks below this level and consecutively closes two 1-hour K-lines below it, then the trend will officially turn bearish, focusing downwards on the 77000 round number and the daily MA5 at 77433. The upward pressure level is first the 1-hour MA10 at 78494, followed by the 4-hour MA5 at 78385 and MA10 at 78358, with strong pressure in the 78500-78600 area, as this has been a region of repeated high and subsequent returns recently. If the price can burst through 78600 with volume, there is potential to challenge 79000 again.
Trading Thoughts
Based on the above analysis, Sister Qinglan provides today's trading thoughts. The current market is at a critical point of a bullish trend but with momentum exhaustion, we adopt a cautious wait-and-see approach, looking for signal confirmation.
Direction: Temporarily watch, do not actively go long or short. If the price breaks below the 1-hour EMA55 and confirms, consider going short.
Entry Conditions: For short entry, the price should break below the 1-hour EMA55 at 77887 and close below this level in two consecutive 1-hour K-lines. At the same time, the MACD histogram should remain negative and expand, and the RSI should fall further below 40 from 47.21. Entry point ranges from 77800-77900.
Stop Loss Level: Strictly set above the 1-hour EMA55, at 78200. If the price stabilizes above EMA55 again, the logic for short positions becomes invalid.
Target Levels: The first target is the 77000 round number, the second target is the daily MA5 at 77433. If it breaks below 77000, then look further to 76500.
If the price stabilizes above EMA55, and the 15-minute RSI rebounds from the oversold area back above 30, while the 1-hour MACD histogram begins to shorten, there may be a short-term rebound opportunity. However, the rebound height is limited, and it is not advisable to chase long; it is only suitable for ultrashort-term experts to make light speculative trades.
Risk Reminder
The current market is under dual pressure from geopolitical issues and macro expectations, with speculative rises lacking spot support; any rebound may be suppressed by bears. Please strictly control positions and manage risks effectively.
Follow Qinglan's Crypto Classroom to seize more trading opportunities! Welcome to visit the official website www.qinglan.org
📊 Qinglan TPV Trading Strategy Backtest Reference
🕒 Last Backtest Time 05-03 07:00:02
Total Analysis: 1262 Backtest: 1256 Accuracy Rate: 68.2% (856/1256)
免责声明:本文章仅代表作者个人观点,不代表本平台的立场和观点。本文章仅供信息分享,不构成对任何人的任何投资建议。用户与作者之间的任何争议,与本平台无关。如网页中刊载的文章或图片涉及侵权,请提供相关的权利证明和身份证明发送邮件到support@aicoin.com,本平台相关工作人员将会进行核查。