Bitcoin is standing in front of what I believe is the most critical price position in recent months. The range between $80,000 and $81,000 is not just ordinary technical resistance; it is the "ceiling" of the long bullish market in the past and a true fork determining the market direction going forward.
If you have been observing and waiting during this time, I think that patience is justified, and this week is still not the time to chase after longs. Whether the price can truly maintain above this level needs time to verify, and the risk of a "one-day trip" false breakout still exists. Before the structure is confirmed, the cost of entering hastily is often greater than the regret of missing out.
However, I also don't want to avoid another possibility: If Bitcoin effectively breaks through and stabilizes this time, then the fluctuations of these past few months may be coming to an end, and we will actively position for longs and participate accordingly.
Summary of the core trading views this week:
- BTC multi-cycle trend structure analysis (detailed in part one)
- BTC market prediction for this week and mid to short-term operational strategies (detailed in part two)
- HYPE hourly level trend structure deep analysis (detailed in part three)
- HYPE market prediction for this week and short-term operational strategies (detailed in part four)
- Review of last week’s operations: HYPE short-term long position profit of about 5.77% (detailed in part five)
Therefore, this week's core is centered around one question - Can Bitcoin truly break through $80,000 to $81,000? Let's analyze it layer by layer from the daily to the hourly levels.
I. Bitcoin Multi-Cycle Trend Structure Analysis
1. BTC Daily Level Trend Structure Analysis: (Based on the market after the low point on February 6, 2026)
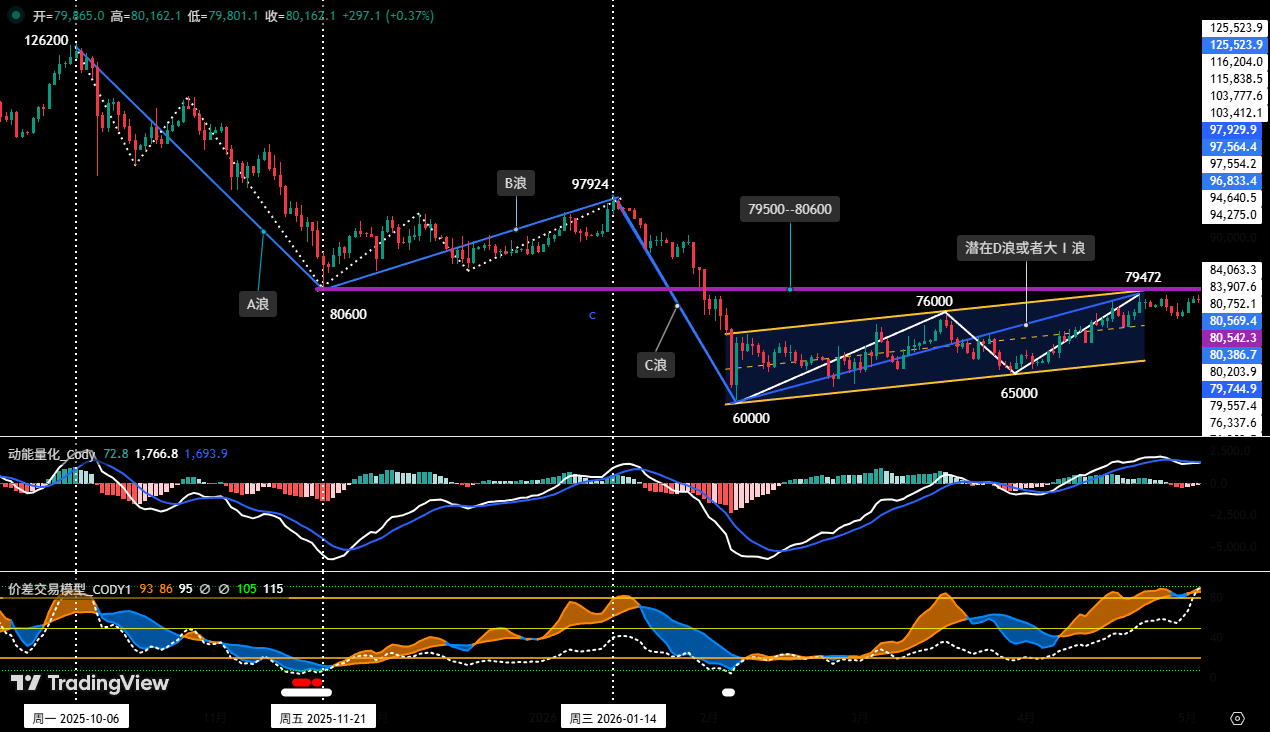
Figure One
As shown in (Figure One), Bitcoin is currently in the critical price range of $79,500 to $80,600 (marked as the purple area in the figure), which has become the market's core "watershed." The effectiveness of its resistance will directly determine the nature and subsequent direction of the rebound since the low of $60,000 on February 6.
Below are two core path analyses:
First Path: Effective upside breakout and stabilization increase the possibility of confirming a trend reversal
- Trigger Conditions: If the price can break through effectively and stabilize above this area, and the upward momentum (space and time) continues to expand.
- Technical Judgment: This could mean that the daily level adjustment since the October 2025 high point ($126,200) has ended at the February 6 low point (around $60,000), and the market trend might have undergone a fundamental reversal.
- Future Outlook: This round of rebound can be seen as the potential starting point of the major wave I (driving wave). It may then undergo a major wave II (corrective wave) pullback, but the probability of completing the adjustment above $60,000 is relatively high.
Second Path: Failed ascent increases the risk of a downward continuation
- Trigger Conditions: If the price encounters resistance in this area, presenting as a "one-day trip" or "false breakout," followed by a rapid decline.
- Technical Judgment: The nature of this rebound is more likely a D wave recovery within a potential downward trend, rather than a trend reversal.
- Future Outlook: After the rebound ends, an E wave adjustment will follow, with a high likelihood of breaking down below the previous low of $60,000.
In summary: In simple terms, this price area is a touchstone for market sentiment. Stabilizing here opens the bullish space, while failure may imply a deep retracement. In this area, the outcome of the game between bulls and bears will guide the core direction of the next stage and serves as a key reference for assessing potential market structure changes.
2. BTC Hourly Level Trend Structure Deep Analysis: (Using a 4-hour analysis cycle)
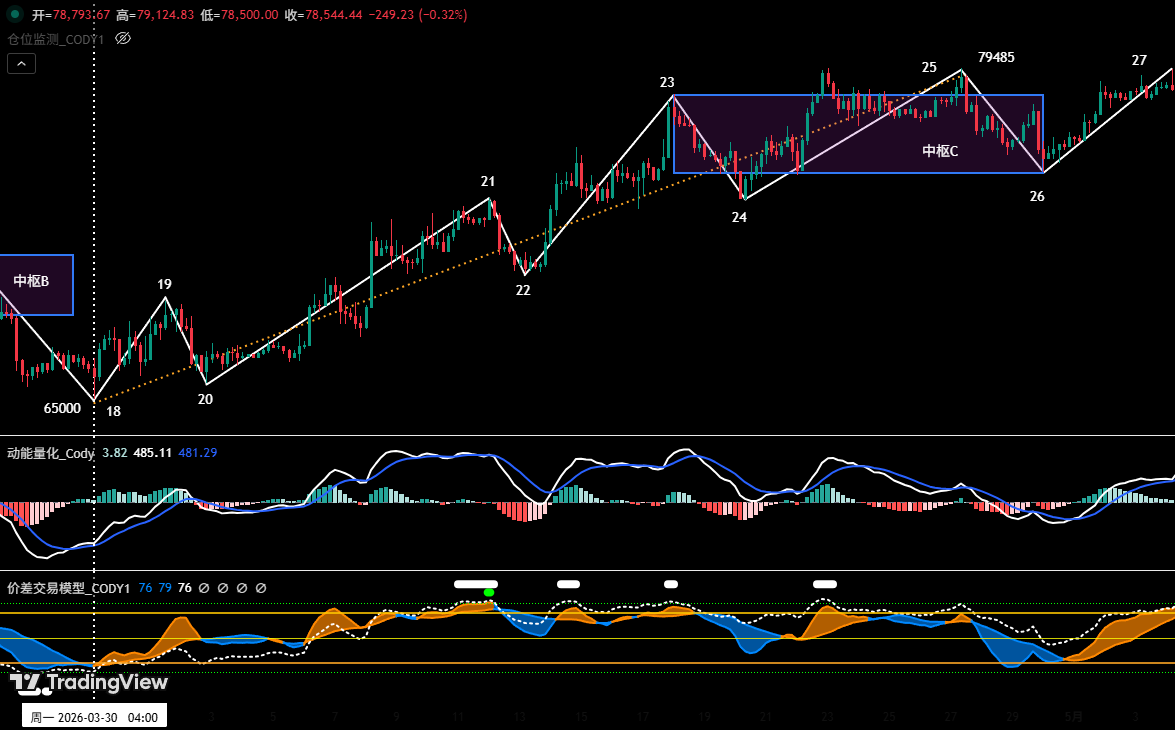
Figure Two
As shown in (Figure Two), since the March 30 low of $65,000, the daily level rebound can be subdivided into nine segments in the 4-hour level: 18-19, 19-20, 20-21, 21-22, 22-23, 23-24, 24-25, 25-26, and 26-27. Among these, the movements from 23-24, 24-25, and 25-26 overlap, forming a "central C." Currently, the market is operating in the departure segment (26-27).
Since the nature of central C is an upward center, it is highly likely that the departure segment endpoint 27 corresponds to a break above the previous high of $79,485 and impacts $80,600.
II. Bitcoin Market Prediction and Operational Strategy for This Week
1. BTC Market Trend Prediction for This Week:
This week's core view: The market price is expected to test the pressure effect around $80,600, with a key focus on whether it can effectively break through the critical resistance zone of $79,500-$80,600. While the easing of geopolitical tensions brings short-term upward momentum, under macro pressures and structural contradictions within the market, it is more likely to present a wide fluctuation pattern.
2. Core Resistance Levels:
- First Resistance Zone: $79,500-$81,000 (near the November 2025 low)
- Second Resistance Zone: $83,500-$84,500 (previous dense transaction zone of bulls and bears)
3. Core Support Levels:
- First Support Level: near $78,500 (near the upper track of the center)
- Second Support Level: $73,500-$75,000 (previous important support level)
- Third Support Level: $69,500-$70,500 (previous important support level)
4. Operational Strategy for This Week (excluding sudden news impacts)
① Mid-term Strategy:
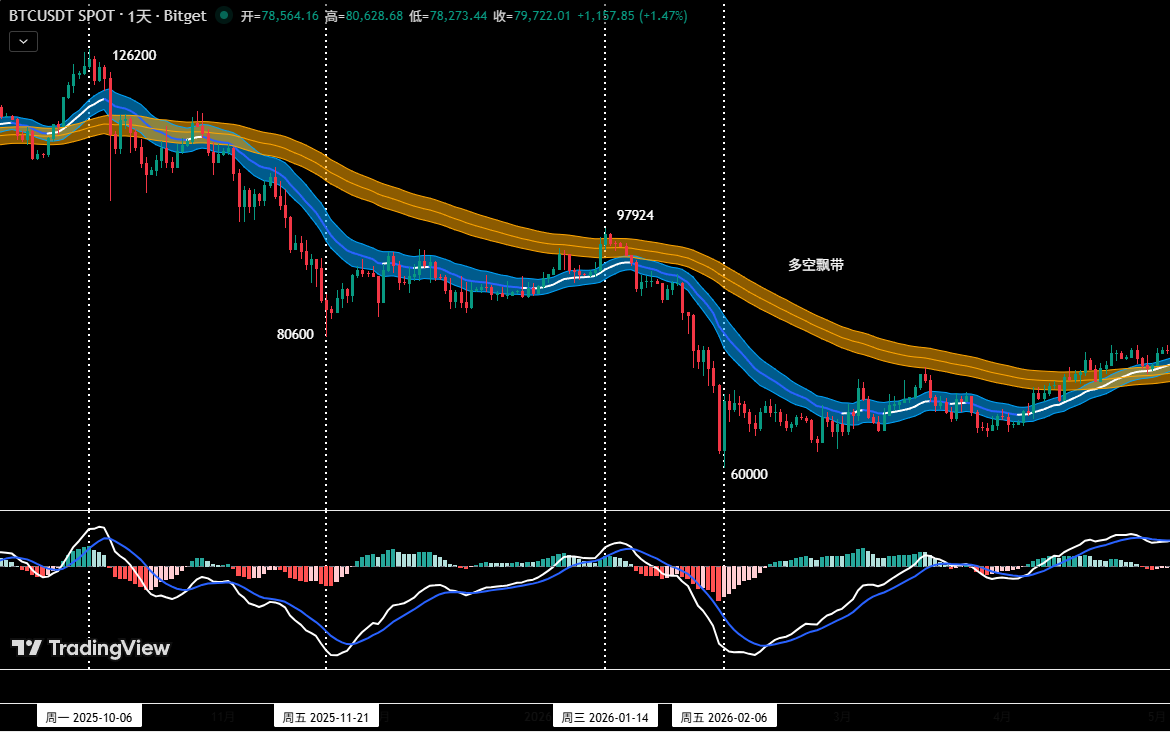
Figure Three
Position Monitoring Model: As shown in (Figure Three), based on trading rules, while Bitcoin has broken through the upper track of bulls and bears but has not yet confirmed its effectiveness, the mid-term strategy this week is to maintain a cautious watching strategy. We suggest waiting until the breakout results are clear before entering the market, and avoid chasing the market up and down.
② Short-term Strategy: Utilize 30% of position, set stop-loss points, and look for "price difference" opportunities based on support and resistance levels. (Using 30 minutes/60 minutes as the operational cycle)
③ A/B Operational Plan: Currently, Bitcoin is about to challenge the core area of $79,500-$80,600, and intra-day fluctuations will intensify. In short-term operations, to dynamically respond to complex market changes, cautious investors should abandon subjective assumptions and instead rely on objective trend structure analysis and quantitative model signals, preparing and strictly implementing two specific operational plans A/B in advance.
Plan A: Effective breakout and stabilization, buy on the dip.
- Opening Position: When the price effectively breaks through and stabilizes in the $79,500-$80,600 area, and combined with bottom signals from the quantitative model, a 30% long position can be established.
- Risk Control: Initial stop-loss set below $78,500.
- Closing Position: When the price rebounds to near important resistance levels combined with model signals, positions can be gradually closed for profit.
Plan B: Effective breakdown of support, short on the rebound.
- Opening Position: When the price effectively breaks below the support around $75,000 combined with top signals from the model, a 30% short position can be established.
- Risk Control: Initial stop-loss set above $76,500.
- Closing Position: When the price drops to important support levels combined with model signals, positions can be gradually closed for profit.
After discussing Bitcoin, let’s talk about HYPE.
In my view, this structure presents a rather classic trend reversal signal—upward momentum is clearly weakening, and the rebound strength is also narrowing. Of course, the trend has not been conclusively determined; if it can effectively break through the previous high of $45.76, then the uptrend hasn’t ended. At that time, it will likely follow Bitcoin's strength. After all, if BTC successfully stabilizes at that level, the overall market sentiment will be lifted, and HYPE is unlikely to remain unaffected.
But until the breakout is confirmed, my advice is: For friends who already hold positions, set stop-profit levels to protect existing profits; for those who do not currently have positions, continue to observe without rushing to chase. Let the structure speak, and then we'll make decisions.
III. HYPE Trend Structure Deep Analysis
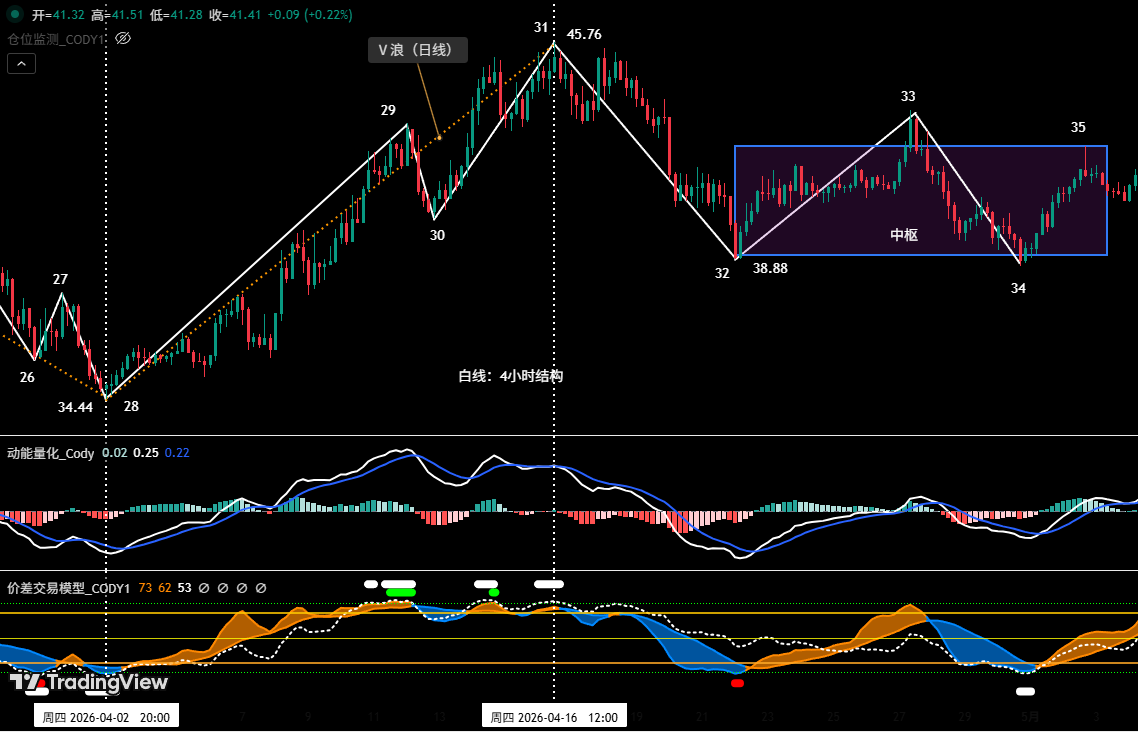
Figure Four
1. As shown in (Figure One), the adjustment trend that started from the April 16 high of $45.76, can be subdivided into four段式 structures—31-32, 32-33, 33-34, and 34-35 in the 4-hour cycle. Among these, the 32-33, 33-34, and 34-35 segments overlap, constructing a "downward center." Currently, the market is in the 34-35 segment.
2. The 4-hour chart shows that HYPE's trend presents a classic trend reversal signal. Specifically, the price broke below the previous low (endpoint 30, $40.17) during the adjustment segment (endpoint 32), while the subsequent rebound segment (endpoint 33) failed to create a new high (i.e., break above endpoint 31, $45.76), forming a potential trend reversal structure of "adjustment breaking previous low, rebound failing to create new high." Thus, technical analysis indicates that the daily rise that started from the April 2 low of $34.44 is likely to end at the previous high of $45.76, and the market is currently in the adjustment stage at the daily level. If the price later effectively breaks below the critical support around $38, it will further confirm this conclusion. Unless the price effectively breaks through and stabilizes above the previous high of $45.76, the bearish structure mentioned above will be invalidated, and the market trend may reverse.
IV. HYPE Market Prediction and Short-Term Operation Strategy for This Week
1. HYPE Market Trend Prediction for This Week:
The core view for HYPE this week: Focus on whether the current 34-35 segment can effectively break above the previous high of $45.76.
2. HYPE Short-Term Operation Strategy for This Week:
- Based on our overall trend shift prediction for HYPE to "adjustment or oscillation," short-term operations should follow the trading principle of "go with the trend, short on the rebound."
- Based on the quantitative model signals we have constructed, using 30 minutes/60 minutes as the operational cycle, utilize 30% of the position to capture entry opportunities.
- Opening Strategy: This week, if resistance signals appear during the rebound in the 34-35 segment (the price at endpoint 35 must be below $45.76), combined with topping signals triggered by the two models, consider entering short positions, ensuring that the position must remain below 30% and strictly adhere to stop-loss discipline.
V. HYPE Operation Review (04.27–05.03)
Last week's trading strategies and core views were validated by the market:
- HYPE short-term trading effectiveness: Last week, HYPE completed a short-term long position operation (1x leverage), achieving a profit of about 5.77%. (Detailed in Table One)
- BTC market trend prediction validation: In last week’s article, we pointed out that the current price is facing dual pressure from the upper track of the daily channel and the core area of $79,500 to $80,600, judging that a direct breakthrough is quite challenging. The current market momentum validates our previous predictive views.
1. Short-Term Operation Review: (See Table One)
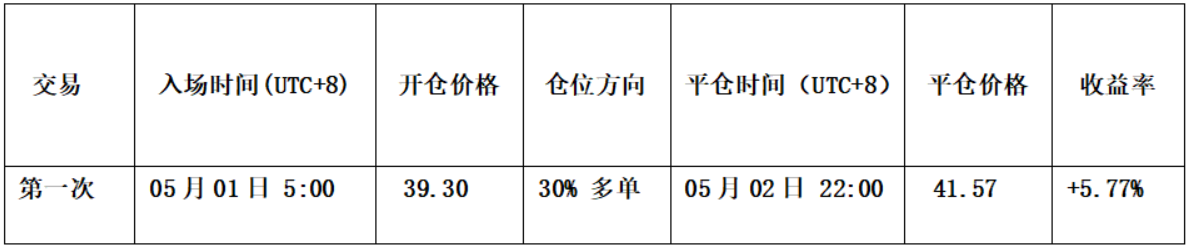
Table One
2. Short-Term Trading Review: (See Figure Five)
- Opening Strategy: First, the previous trend has completed a full adjustment structure; secondly, the price difference trading model has already issued a strong bottom warning signal in advance (red dots, white dots in the figure); thirdly, the momentum quantitative model triggered a bottom divergence signal. Therefore, we established a 30% long position at $39.30.
- Closing Strategy: When the price rose to near $42.5, resistance signals appeared, and the price difference trading model triggered a top warning signal (green dots, white dots in the figure), so we closed all positions at around $41.57.
- Summary: This trade successfully profited approximately 5.77%.
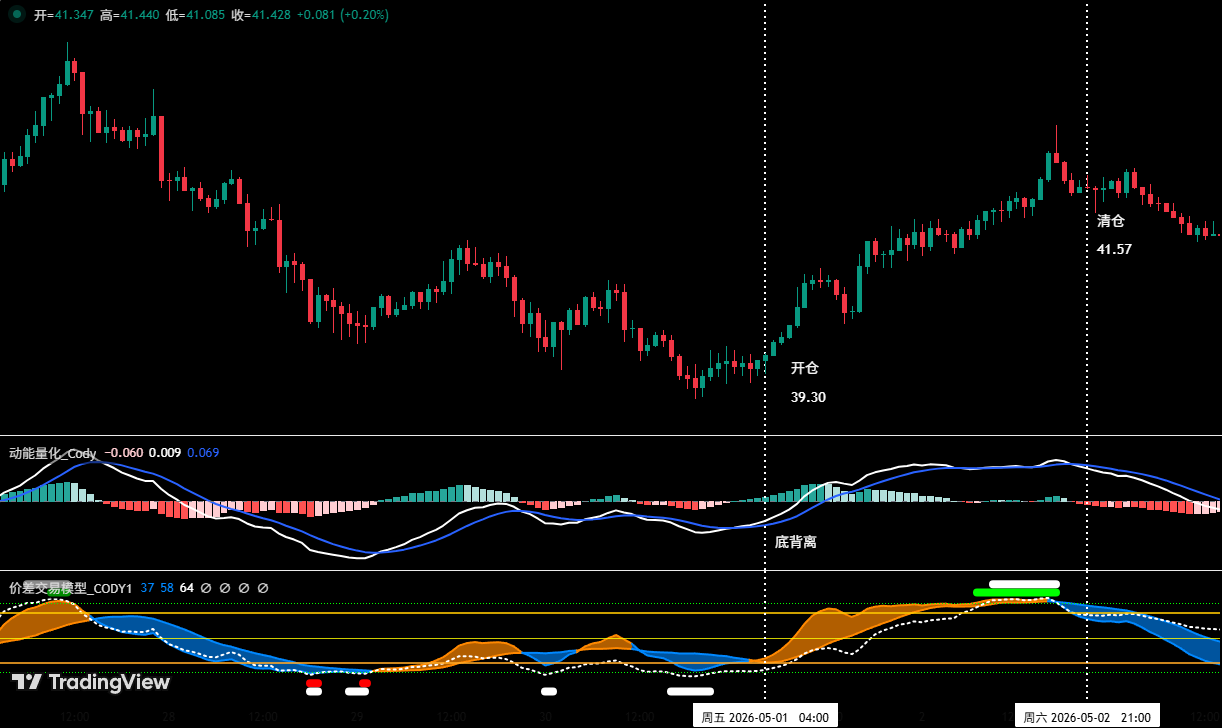
Figure Five
VI. Special Reminder:
- When opening a position: Immediately set the initial stop-loss level.
- When profits reach 1%: Move the stop-loss to the opening cost price (breakeven point) to ensure capital safety.
- When profits reach 2%: Move the stop-loss to the position of 1% profit.
- Continuous Tracking: After that, for every additional 1% profit, move the stop-loss up 1% to dynamically protect and lock in profits.
Financial markets are constantly changing; all market analyses and trading strategies must be dynamically adjusted. All views, analytical models, and operational strategies mentioned in this article stem from personal technical analysis and are for personal trading logs only, not constituting any investment advice or operational basis. The market carries risks; investment requires caution, and decisions should not be made based on this alone.
免责声明:本文章仅代表作者个人观点,不代表本平台的立场和观点。本文章仅供信息分享,不构成对任何人的任何投资建议。用户与作者之间的任何争议,与本平台无关。如网页中刊载的文章或图片涉及侵权,请提供相关的权利证明和身份证明发送邮件到support@aicoin.com,本平台相关工作人员将会进行核查。