Right now, XRP is in a mixed state, where network activity and price are not moving in tandem.
AdvertisementThe graph displays a protracted decline that is followed by tight consolidation in the vicinity of $1.30 to $1.40. The wider trend is under pressure because the price is still trading below significant moving averages. The structure still shows that the market has not fully recovered, and attempts to move higher continue to encounter resistance.
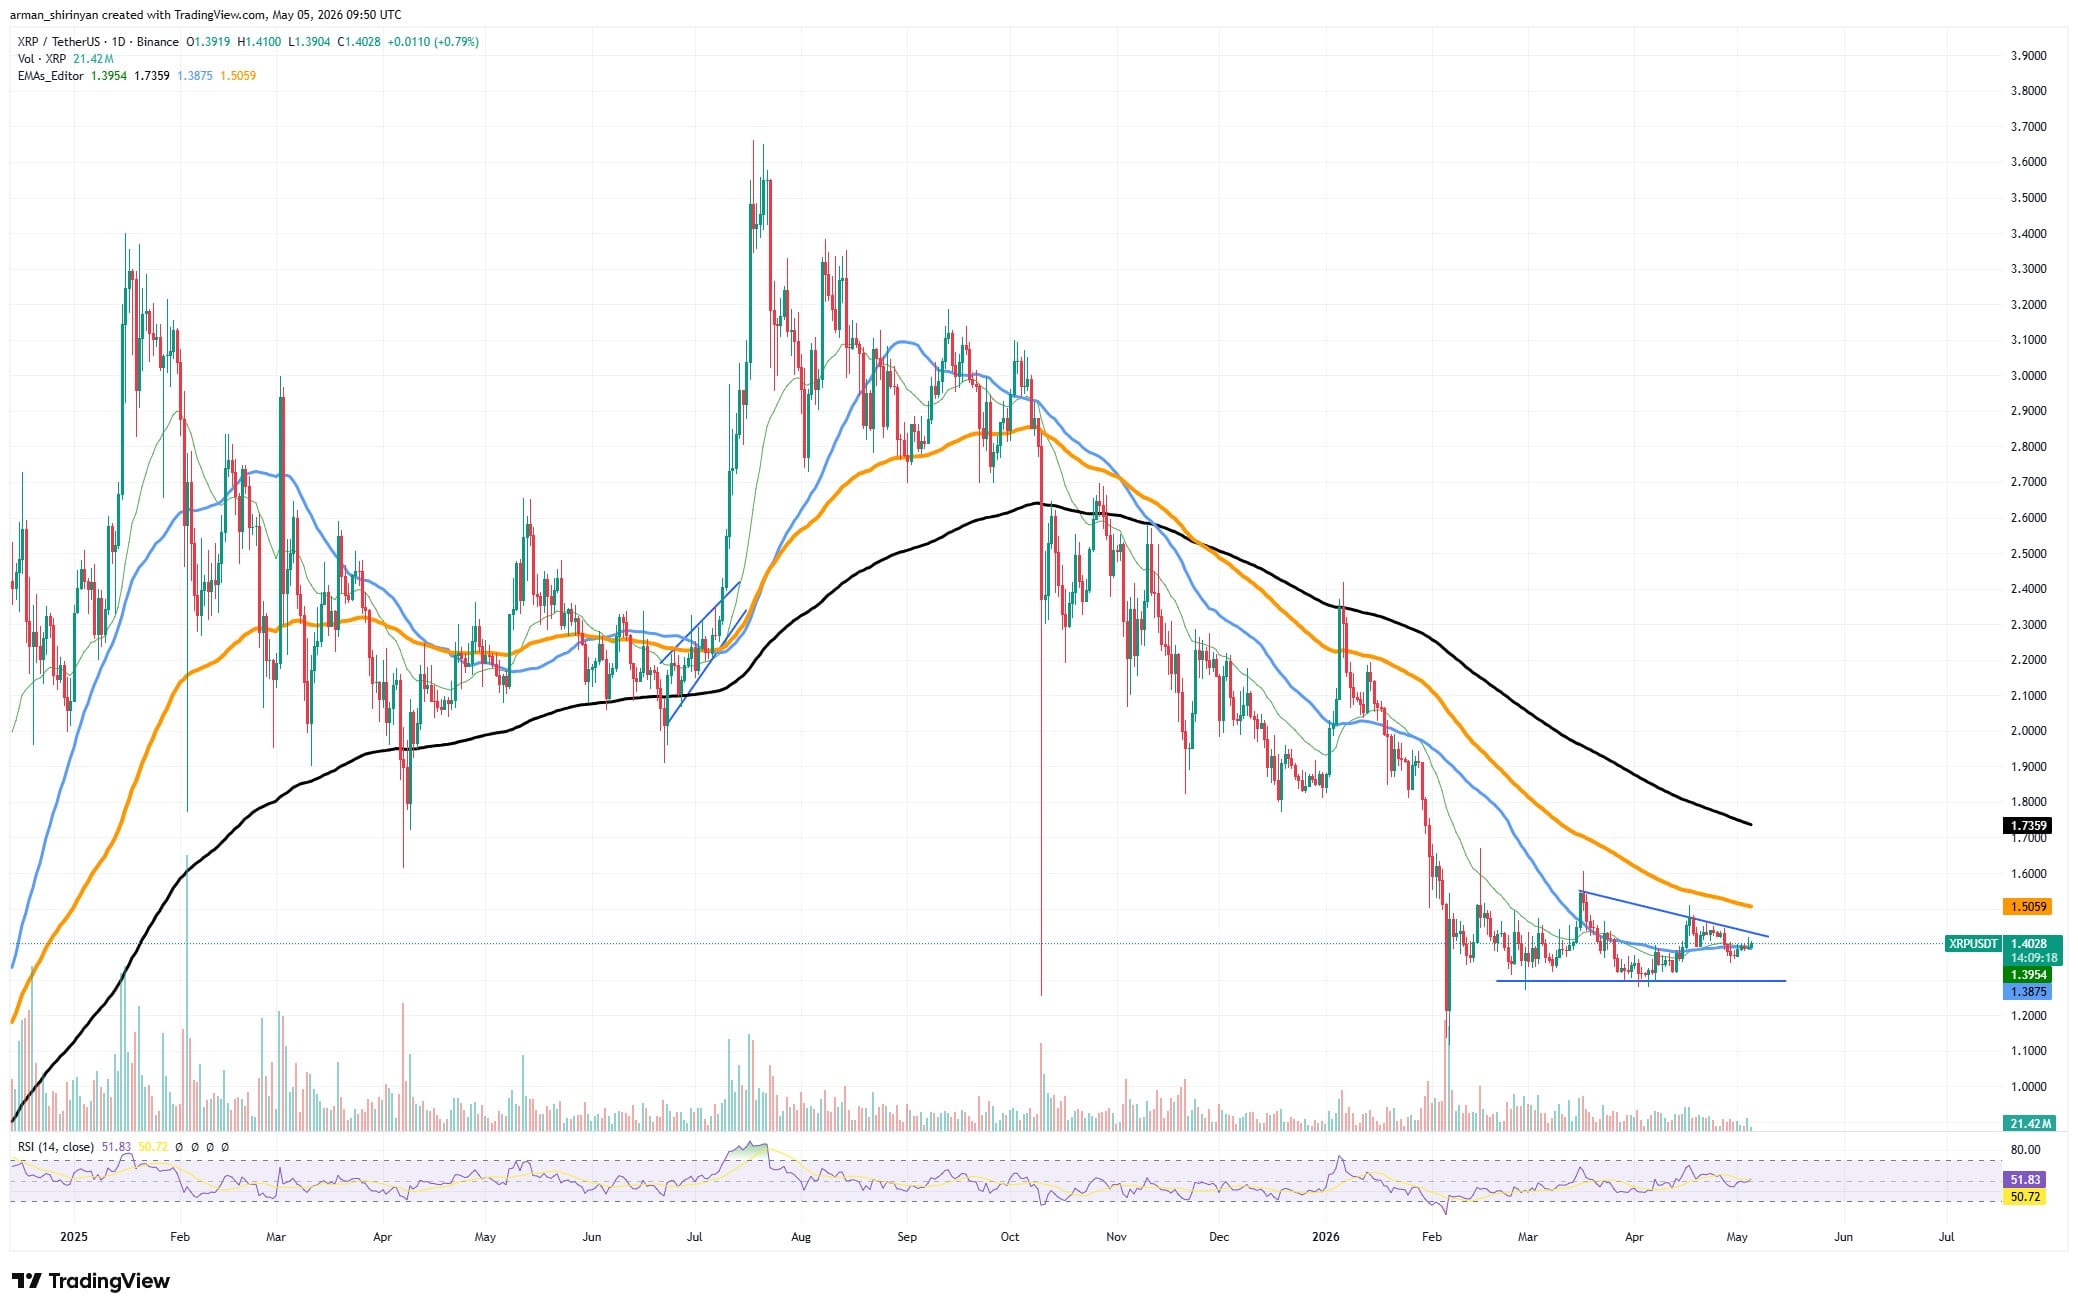
XRP/USDT Chart by TradingView
In terms of usage, the XRP Ledger has suffered greatly concurrently. According to recent data, payment volume fell by about 70% to 75% in a brief period of time, reflecting a significant decline in transactional activity. This type of decline typically indicates a cooldown following a period of high activity, decreased participation, or decreased demand for transfers.
HOT Stories Bitwise Advisor: Bitcoin Set to Explode if It Hits $82K Ripple's Schwartz Reveals His XRP-Only PortfolioBecause XRP depends more on utility than many other assets, this is important. The market's perception of the ledger's value is directly impacted by a decrease in usage because it is designed for payments and settlement.
AdvertisementAre payments important?
The decline in payments is not totally detrimental from a structural standpoint. After prior spikes that raised network activity above sustainable levels, some analysts see it as a reset.
You Might Also Like Mon, 05/04/2026 - 00:01 XRP Folds Under No Pressure Whatsoever, You Need 62 Days to Withdraw Ethereum (ETH), Hyperliquid (HYPE) Paints Falling Star: Crypto Market ReviewByArman Shirinyan
In this way, rather than being a sign of complete weakness, the current phase might be a reflection of normalization. Instead of showing signs of growth, XRP's price is stabilizing. The chart illustrates compression, with resistance continuing to slope downward while price forms a horizontal base.
AdvertisementInvestors should keep an eye on two important factors in the near future. The first is whether payment activity levels off or keeps falling. A stronger bullish case would be supported by an increase in on-chain usage. Price behavior in the $1-$1.40 range comes second. While losing this level allows for more downside, maintaining it keeps the base intact.
免责声明:本文章仅代表作者个人观点,不代表本平台的立场和观点。本文章仅供信息分享,不构成对任何人的任何投资建议。用户与作者之间的任何争议,与本平台无关。如网页中刊载的文章或图片涉及侵权,请提供相关的权利证明和身份证明发送邮件到support@aicoin.com,本平台相关工作人员将会进行核查。


