Friends who trade stocks often encounter: after a satisfying rise in stock prices, a sudden sideways correction leaves them unsure whether to sell or hold. In fact, this kind of "rise for a while, pause for a bit" pattern may represent the classic K-line "air refueling" shape.
Drawing an analogy to driving on the highway: a vehicle needs to refuel after running for a while to continue moving forward, and the logic of air refueling is similar—after a rapid rise in stock prices, there’s a brief rest to recharge, and once the chips stabilize, it will rise again.
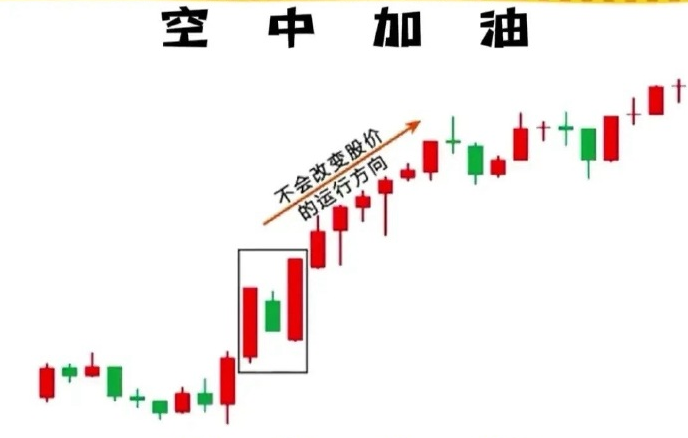
The core of air refueling is the "rest stop during an uptrend," rather than a signal of reaching a peak. Its essence is the main force washing the plates: when retail investors take profits and exit, selling pressure arises; the main force causes fluctuations at high positions to let the weak hands sell, while they absorb the stocks, reducing the cost of lifting. This fluctuation process is "refueling."
Remember the following characteristics, and even beginners can quickly identify it without memorizing complex K-lines.
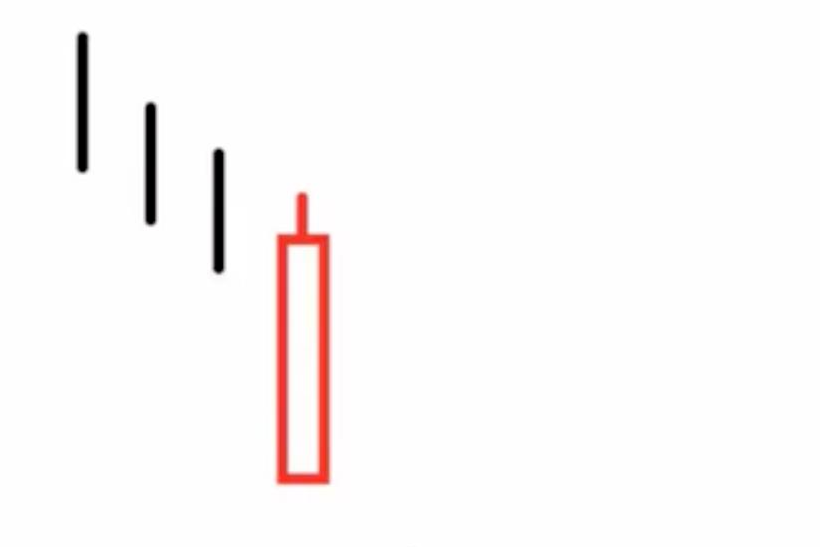
First, there must be previous increases: air refueling occurs only after a significant rise, typically over 20%, often characterized by consecutive medium to large bullish candles (the take-off phase); price stagnation or decline does not count as refueling.
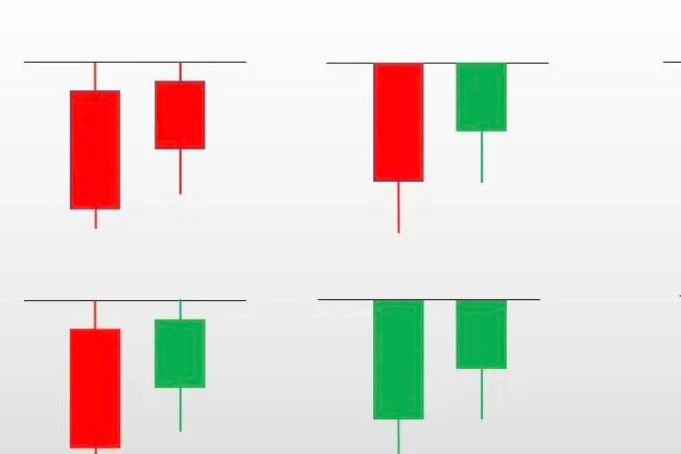
Second, shrinking volume during slight fluctuations without deep declines (key to distinguishing true and false): the fluctuation range ≤10%, K-lines are mostly small bearish and bullish candles or dojis, and trading volume obviously shrinks or even reaches the lowest level, indicating the main force has not sold; if the volume is high with bearish candles, it is likely that the main force is offloading.
Third, a volume breakout signals the end: after refueling is complete, a medium to large bullish candle breaks the fluctuation platform, and the volume on the breakout day significantly increases (even exceeding previous levels), indicating that the main force is starting a new round of price rises.
Beginners can easily misjudge true refueling, so two tips for avoiding pitfalls must be remembered.
First, look at the support level: true refueling during a correction does not break below the 20-day moving average; even if it does, it quickly recovers; if it breaks and does not stand firm, then the refueling has failed, and you need to cut losses in time.
Second, consider the consolidation time: the typical cycle is 3-20 trading days; the shorter the time, the stronger the main force's control; if the sideways movement exceeds 20 days, the bullish momentum depletes, and the trend is likely to turn bad.
Air refueling is not infallible, so prioritize looking for safer options in hot sectors. No technical pattern is 100% accurate; you must set stop-losses during operations to avoid expanding losses.
In summary: air refueling is a recharging process midway through a price rise, characterized by "first a rise, then a shrinking volume fluctuation, followed by a volume breakout," and its essence is the main force washing the plates for energy stocking. Beginners should remember the characteristics, distinguish between true and false, and combine sector and trading volume to greatly increase the likelihood of catching upward opportunities.
Finally, a reminder: the core of K-line patterns is to understand the logic of funds, not to memorize shapes rigidly. Observing and summarizing more will help avoid pitfalls; the stock market has risks, and rational investment is the long-term path.
Currently, major platforms have strict reviews, and market opinions and trend sharing are easily restricted. Friends who want to exchange market views, synchronize trading ideas, and learn from each other's review logic, +{three lines}Daniu4416. Daily real-time synchronization of market dynamics, partners for reviewing discussions, and rational exchanges of references for steady growth together.
This content is only for exchanging market trend opinions and sharing personal review ideas, not constituting any investment advice.
免责声明:本文章仅代表作者个人观点,不代表本平台的立场和观点。本文章仅供信息分享,不构成对任何人的任何投资建议。用户与作者之间的任何争议,与本平台无关。如网页中刊载的文章或图片涉及侵权,请提供相关的权利证明和身份证明发送邮件到support@aicoin.com,本平台相关工作人员将会进行核查。