Abstract
In early May 2026, the global crypto market exhibited extreme differentiation and high uncertainty under the joint disturbance of three macro variables. On the geopolitical front, Trump announced a high-profile launch of the "Freedom Plan" to escort merchant ships in the Strait of Hormuz on May 4, only to dramatically announce its suspension a day later, claiming "significant progress has been made in the US-Iran comprehensive agreement." However, Iran insisted that it was still in a state of war with the US and continued to close the strait, requiring all transiting vessels to obtain Iranian permission. From the Federal Reserve's side, around May 15, Waller will officially take over from Powell as chair, while the April 30th interest rate meeting remained unchanged as expected. The Beige Book indicated that the significant increase in energy prices had created comprehensive pressure on business costs across 12 districts, prompting Goldman Sachs to raise its year-end core PCE forecast to 2.6%. Under these macro headwinds, Bitcoin rebounded strongly from a low of $60,000 in early February, regaining the $80,000 level, but the continued macro pressures create uncertainties about whether the rebound can be solidified. Meanwhile, institutional behavior showed a rare characteristic of "counter-trend accumulation": on May 1, US spot BTC ETF saw a net inflow of $630 million in a single day, with BlackRock's IBIT alone accounting for $284 million, and Fidelity's FBTC recording $213 million. Overall, the game between macro pressure and institutional bullishness is entering a critical phase, with the market direction's choice depending on the resonant rhythm of three major variables: geopolitics, the Federal Reserve, and institutional funds.
1. Geopolitical Game: The Backtrack of the "Freedom Plan" in the Strait of Hormuz and the Resurgence of Inflation
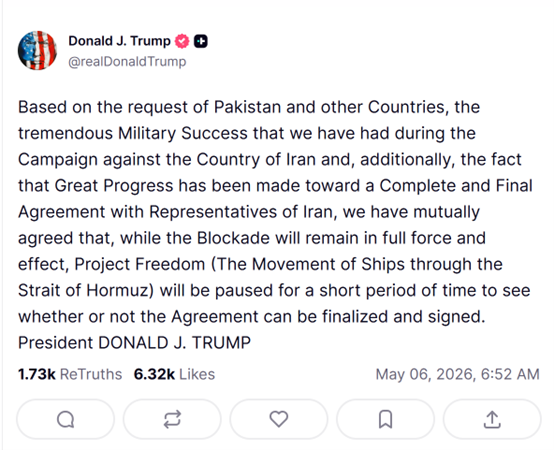
On May 4, 2026, US President Trump announced on Truth Social that the United States would officially launch the "Freedom Plan" for the escort of merchant ships through the Strait of Hormuz on that morning in Middle Eastern time, deploying missile destroyers, over 100 land and sea aircraft, multi-domain unmanned platforms, and 15,000 active-duty military personnel. The US characterized it as "defensive humanitarian action," aiming to bypass the 60-day authorization limitation of the US War Powers Act regarding presidential military action. However, just a day later, Trump issued a statement announcing the suspension of the "Freedom Plan" execution, emphasizing that the maritime blockade against Iran "will continue to be fully and effectively implemented." This dramatic reversal caught the global market off guard, leading to violent fluctuations in oil prices after the news was announced.
Iran's stance is much more rigid than the US's statements. Iran's Supreme Leader's foreign affairs advisor, Velayati, clearly stated that the Strait of Hormuz has been closed and will not be reopened unless "the national will of the Islamic Republic of Iran decides"; all vessels planning to pass through the strait must submit applications through official channels and obtain passage permission from Iran. The chairman of Iran's National Security Committee warned that any foreign armed forces (especially US troops) approaching or entering the Strait of Hormuz would face repercussions. The diverging positions of both sides on key issues such as the nature of the ceasefire, the right of passage through the strait, and whether the "Freedom Plan" is genuinely suspended highlight that the market's pricing of geopolitical risk is far from relaxed.
The direct consequence of this geopolitical game has begun to show initially in global inflation data. Due to the ongoing escalation of military conflicts between the US and Iran, coupled with the UAE's announcement of its withdrawal from the OPEC+ alliance on May 1, international oil prices have continuously risen from late April to early May, pushing energy prices significantly higher. Goldman Sachs promptly raised its year-end core PCE inflation forecast from a previous 2.5% to 2.6%, with the overall PCE forecast raised from 3.1% to 3.4%. More worrisome is that the driving force behind this inflation is not from overheating demand but from supply shocks (oil prices) compounded by tariff effects, making the Federal Reserve's monetary policy response mechanism more complicated—unable to easily raise interest rates (for fear of aggravating economic downturn pressure), while also struggling to initiate interest rate cuts (with rising risks of inflation expectations becoming unanchored). For Bitcoin, this "stagflationary" macro environment historically tends to impose dual pressures on it: its safe-haven properties have not gained widespread consensus, while liquidity contraction expectations continue to suppress risk asset valuations.
2. The Eve of Fed Leadership Change: The Beige Book Warning and the Crossroads of Policy Independence
In mid-May 2026, the Federal Reserve is about to undergo the most controversial chair transition in modern history: Kevin Warsh will officially take over from Jerome Powell as Fed Chair. Powell broke with 75 years of tradition by continuing to serve as a Fed governor after stepping down as chair, a move widely interpreted in the market as a political compromise reflecting a "not completely decoupled" relationship between the White House and the Fed. Warsh's policy stance exhibits a subtle "hawk-dove mix" characteristic: hawkish on inflation management and balance sheet management, emphasizing monetary policy discipline and framework reconstruction, and has publicly criticized the Fed's ultra-loose policies of the past 20 years as "seriously deviating from its mission"; but he is dovish on long-term interest rate paths, acknowledging the natural suppression of inflation by technological advances and supports interest rate cuts when data allows. This mixed stance has created significant disagreement in the market regarding the monetary policy trajectory in the "Warsh era," becoming a key source of uncertainty in the macro pricing of the crypto market in May.
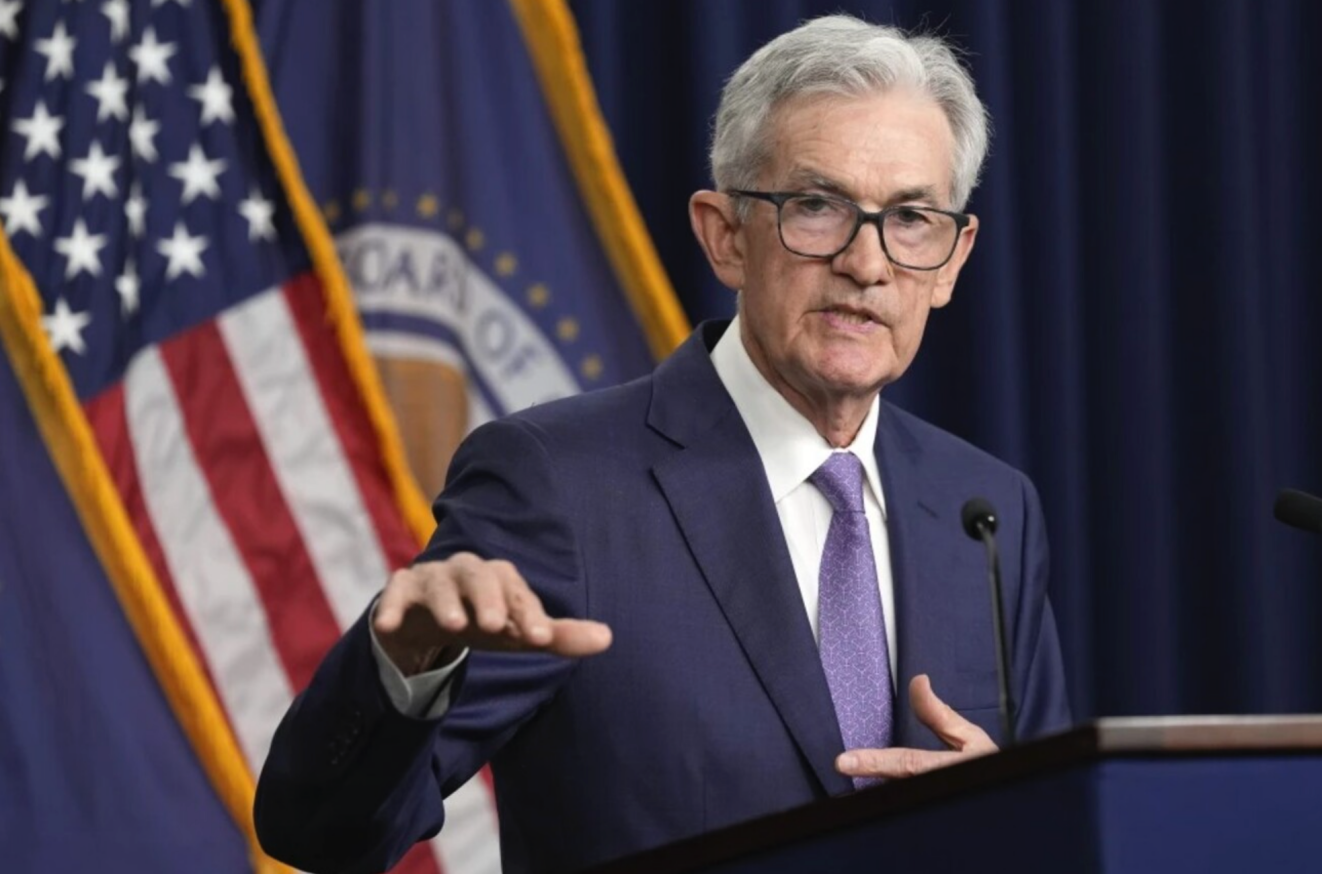
The Federal Reserve's interest rate meeting on April 30th was Powell's last meeting as chair. As the market widely expected, the federal funds rate was kept unchanged at 3.50% to 3.75%. The post-meeting statement and Powell's press conference conveyed complex signals: on one hand, the impact of rising energy prices on inflation "has begun to manifest and may further expand in the short term"; Powell clearly stated, "currently no officials support raising interest rates, but some officials advocate reducing the easing tone in the interest rate meeting statements"; on the other hand, Powell emphasized that after his departure, he "will not become a shadow chair," attempting to soothe market concerns about the potential loss of Fed policy independence. However, just days after the meeting ended, internal divisions at the Fed surfaced: Trump-nominated governor Stephen Moore cast a dissenting vote in support of interest rate cuts, while Cleveland Fed President Mester, Minneapolis Fed President Kashkari, and other hawkish heavyweights also cast dissenting votes (but to maintain the unchanged status), highlighting the intense divisions within the Fed that cast a shadow of high uncertainty over the first interest rate meeting after Warsh's takeover.
The Beige Book released on April 16 provides valuable grassroots insights for understanding the true state of the current US economy. The report indicates that 8 out of 12 Federal Reserve districts maintained slight to moderate expansion, 2 districts showed virtually no change in economic activity, and 2 districts experienced slight to moderate declines. The most concerning statements related to inflation include: "Energy and fuel costs have surged in all 12 districts," with businesses generally reflecting that input cost increases have outpaced sales price increases, compressing profit margins. Companies' decisions regarding hiring, pricing, and capital investment have become more complex, with "wait-and-see" becoming the most common business strategy. For crypto assets, the core signal conveyed by the Beige Book is that although the US economy has not fallen into recession, growth momentum is being eroded by energy inflation, and the path for the Fed to cut interest rates will be more tortuous than previously anticipated in the market. This creates a suppressive macro backdrop for the crypto market renowned for being sensitive to liquidity.
3. The Institutional Deep Water Zone: ETF Counter-Trend Fundraising and Mining Companies' Balance Sheet Optimization
Against the backdrop of Bitcoin's price retreat from its highs, institutional funds' counter-trend buying behavior has become one of the most noteworthy structural signals in the crypto market in May 2026. According to SoSoValue data, on May 1, US spot Bitcoin ETFs saw a net inflow of as much as $630 million in a single day, with BlackRock's IBIT alone accounting for $284 million at the top, and Fidelity's FBTC recording $213 million in second place; on May 4, the spot ETF recorded another $532 million net inflow. This capital flow showed a significant divergence from BTC price trends: prices fluctuated repeatedly between $76,000 and $81,000, but ETFs continued to record net inflows, indicating that institutions are steadily accumulating despite price weakness, rather than the behavior patterns of retail investors who chase highs and sell lows. By early May, the total net asset value of US spot BTC ETFs had reached $10.3785 billion, representing about 6.66% of Bitcoin's total market cap. The sustained rise in the share of institutional holdings is fundamentally changing Bitcoin's price discovery mechanism—from a highly volatile speculative asset dominated by retail investors to a gradually transitioning asset suitable for institutional allocation.
From a broader perspective, the deepening institutional process is reshaping Bitcoin's supply and demand balance sheet. Since the approval of the US spot Bitcoin ETF in January 2024, the ETF channel has accumulated over 580,000 BTC, which is equivalent to approximately three years of Bitcoin network production. Meanwhile, the supply of long-term holders has been continuously rising since mid-February 2026, indicating that during the price adjustment process, the holding willingness of long-term investors is increasing rather than decreasing. This "combined lock-up of institutions and long-term holders" pattern leads to a continuous contraction of Bitcoin's actual circulating supply, providing implicit support for prices amid macro headwinds.
4. Bitcoin Returning to $80,000: Halving Cycle Patterns and the Long-Short Dialectics at Current Node
At the time point of early May 2026, Bitcoin is performing a key act of a strong return from a deep correction. BTC once dropped to a low of around $60,000 in early February, then rebounded strongly to the $80,000 level in early May, reflecting a rebound of over 33% from the lowest point in this adjustment cycle. This "return to $80,000" trend still shows about 46% retracement compared to the historical high reached in October 2025, but compared to the panic selling of retail investors and massive shutdowns of mining companies during the severe bear markets of 2018 and 2022, the adjustment in 2026 presents distinctly different structural characteristics: continuous net inflow into ETFs, rising holdings of long-term holders, and leading mining companies optimizing their balance sheets instead of cutting production or exiting. These signals collectively point to one judgment—that the current situation is more likely a "deep adjustment within a bull market" rather than the start of a bear market indicating "the end of the bull market."
From the perspective of halving cycle patterns, Bitcoin will complete its fourth halving (block reward from 6.25 BTC reduced to 3.125 BTC) in April 2024, and historical data shows that the 12 to 18 months following a halving is typically the most intense phase for price discovery. Approximately 12 months after the 2012 halving, BTC broke previous highs; about 17 months after the 2016 halving, it entered a major uptrend; and roughly 12 months after the 2020 halving, it reached a cycle high. If we refer to this historical pattern, the 12 to 18 months window following the April 2025 halving corresponds to the period from April 2026 to October 2026, which happens to be the current timeframe. This suggests that the current price adjustment is very likely part of a "washing and building momentum" process post-halving, rather than a top reversal of the cycle. Of course, whether this historical pattern remains valid under the new environment of deepening institutionalization presents high uncertainty.
Technically, the core trading range for Bitcoin after "returning to $80,000" is between $76,000 and $83,000. The $80,000 level itself is an important psychological barrier and short-term support level, while $83,000 is where the 200-day simple moving average is located, also serving as the "bull-bear dividing line" that both sides will fiercely contest; if an effective daily breakout occurs, the upside targets will point toward the $89,000 to $94,000 range. The downside $76,000, is a low point tested multiple times in April 2026; if it is lost, the technical downside target will point to the range of $70,000 to $65,000. From momentum indicators, RSI-7 has risen to 71.27, approaching the overbought area, which presents a risk of technical pullback in the short term; however, MACD formed a golden cross in mid-April, providing some momentum support for a mid-term upward advance. Overall, the most reasonable judgment at this node is that BTC is in the "confirmation phase after returning to $80,000"; the range fluctuations may continue for another 2 to 4 weeks until clear signals from macro catalysts appear.
5. Outlook: Three Scenario Simulations and Key Observational Nodes
Considering the three main lines of geopolitical developments, Federal Reserve policy trajectories, and institutional capital flows, the crypto market from May to July 2026 may evolve along the following three scenarios.
Scenario One (Approximately 35% Probability): Geopolitical easing + Fed releases dovish signals, BTC challenges $89,000 to $94,000. If the US and Iran reach a substantial framework agreement during the negotiation window following the suspension of the "Freedom Plan," normal passage through the Strait of Hormuz resumes, oil prices retreat from highs, and inflation expectations subsequently cool; simultaneously, Warsh releases dovish signals in his first public speech after taking office on May 15. The simultaneous warming of these two major lines will trigger a macro-level "double-click" effect: significant repair of risk appetite, accelerated ETF fund inflows, and BTC is expected to break through $83,000 (200-day line) within 2 to 4 weeks and launch an assault toward the $89,000 to $94,000 range. Key observational nodes for this scenario include: Warsh’s inaugural speech around May 15, the release of April US non-farm payroll data on May 8, and phase announcements regarding US-Iran negotiations.
Scenario Two (Approximately 45% Probability): Geopolitical stalemate continues + Fed remains on hold, BTC maintains a range of $70,000 to $85,000. This is the most sufficiently priced neutral scenario in the current market. The US and Iran fail to reach a comprehensive agreement during the four-week ceasefire period, but no new large-scale military conflict erupts, and the Strait of Hormuz remains in a "partial blockade" state; the Federal Reserve maintains a "data-dependent" position after Warsh takes office. In this scenario, BTC is most likely to maintain a wide fluctuation pattern, with ETF capital flows becoming the most direct driver of short-term prices—if weekly net inflows remain above $300 million, prices will lean toward the upper bound; if a week shows net outflows, prices will test the lower support bound. In this scenario, range trading is the most suitable strategy for most investors.
Scenario Three (Approximately 20% Probability): Geopolitical conflict escalates + inflation spirals out of control, BTC retreats to the $65,000 to $70,000 range. If the ceasefire agreement completely breaks down and Iran announces a total blockade of the Strait of Hormuz, oil prices break above $120 per barrel, and Goldman Sachs is forced to further raise its year-end PCE forecast; Fed hawkish officials openly discuss the possibility of using interest rate hikes to address inflation if necessary. This macro "perfect storm" will impact liquidity expectations and risk appetite simultaneously, potentially causing BTC to fall below the psychological level of $70,000. Although the probability is relatively low, if this occurs, the leveraged positions in the crypto market will face systemic liquidation pressure. In this scenario, cash and short-term government bonds are the optimal holdings, and Bitcoin should be positioned once the macro turning point is confirmed.
6. Conclusion: Identifying Structural Signals Amid Macro Fog
The crypto market in May 2026 is at a historical convergence point of three main lines: geopolitical issues, monetary policy, and institutionalization processes. The dramatic backtrack of the "Freedom Plan," policy uncertainties brought by the change in Fed chairs, the verification period for Bitcoin's halving cycle patterns, and the structural changes of persistent counter-trend accumulation in ETFs together constitute an extremely complex and rich macro chessboard. For investors, the key to understanding this stage lies in distinguishing "noise" from "signal": the back-and-forth nature of geopolitical events and the hawkish-dovish battles among Fed officials are essentially short-term noise—they affect prices on a daily to weekly basis but cannot alter the medium-term trend direction indicated by the structural signals of deepening institutionalization and the supply contraction of the halving cycle.
Macro headwinds are often the best friends of long-term allocators. The macro pressures that Bitcoin experienced in May 2026—rising oil prices, indecisive Fed stance, and ongoing geopolitical conflicts—are in fact milder compared to the darkest moments of the “liquidity crisis” in March 2020 and the “FTX collapse + aggressive Fed rate hikes” in 2022. Moreover, the continuous rise in institutional holdings, the ongoing expansion of ETF product lines, and the fact that leading mining companies can still optimize their capital structures during downturns all quietly tell a larger narrative: Bitcoin is gradually evolving from a speculative asset on the fringes to a permanent member of the global asset allocation landscape. This process is full of volatility, but the direction is clear. We suggest focusing on three key variables: first, Warsh's inaugural speech around May 15 will determine the re-pricing direction of interest rate cut expectations; second, the substantial progress in US-Iran ceasefire negotiations within the four-week window will decide the evolution path of oil prices and inflation expectations; third, if the weekly capital flows of US spot BTC ETFs show net inflows exceeding $500 million for two consecutive weeks, this will be the most direct signal for institutions to accelerate their accumulation. The macro fog will eventually dissipate, and those investors who maintain their composure and identify structural signals amid the fog will be the most composed winners in the next round of market trends.
免责声明:本文章仅代表作者个人观点,不代表本平台的立场和观点。本文章仅供信息分享,不构成对任何人的任何投资建议。用户与作者之间的任何争议,与本平台无关。如网页中刊载的文章或图片涉及侵权,请提供相关的权利证明和身份证明发送邮件到support@aicoin.com,本平台相关工作人员将会进行核查。


