This report delves deeply into the evolution of liquidity in the crypto ETF market, the profound impact on the volatility of underlying assets, the mechanisms and market conditions of leveraged ETFs. At the same time, the report provides a detailed comparison of the differences between crypto market leveraged ETFs and traditional financial market leveraged ETFs, and based on real-time trading data from the Gate platform, constructs trading strategies that offer practical guidance. The strategy centers on "entering from the right side" and superimposes volume-driven momentum breakout signals to achieve excess returns. By gradually building positions, increasing momentum, and implementing strict exit mechanisms, it manages to achieve a dynamic balance between risk and return while controlling volatility loss.
1. Introduction: At the Development of Crypto ETFs, Who is Actually Investing Money?
The early crypto market resembled a series of scattered private transactions, mainly relying on over-the-counter (OTC) matchmaking. At that time, liquidity was highly fragmented, and the bid-ask spread was vast, with a slightly larger order potentially leading to severe price volatility. As derivatives markets entered the spotlight, especially with the introduction of short-selling mechanisms and the popularization of basis arbitrage strategies, price discovery in the crypto market became more efficient, and the bid-ask spread saw significant narrowing. Particularly, perpetual contracts on centralized exchanges accelerated the growth of trading volume.
What truly brought the market into the spotlight was the listing of crypto spot ETFs. ETFs introduced a key player: Authorized Participants (APs). They act as regulators of the market: when ETF prices exceed net asset value (NAV), APs purchase shares and sell them in the market, pressing down the premium; conversely, the same goes for discounts. This arbitrage mechanism not only nearly eliminated ETF premiums and discounts but more importantly, it injected continuous institutional-level deep liquidity into the entire market.
Taking BlackRock's IBIT as an example, it took only 47 trading days since its listing to surpass $10 billion in management scale. In contrast, the previously fastest gold ETF, GLD, took nearly three years to reach this scale. Furthermore, in the explosive year of 2025 for the Digital Asset Trust (DAT), all newly issued spot crypto ETFs and the funds absorbed by crypto asset trusts accounted for over 12% of the total market circulation. This proportion implies that institutional holdings have transformed from being trivial to a key force that can influence market supply and demand.
As the principal players in the market shift from high-frequency traders and crypto native users to institutions, the rhythm of the market subtly changes. Traditional financial theory presents two opposing hypotheses on the impact of ETFs: one suggests that the "arbitrage transmission mechanism" of ETFs will dampen volatility in underlying assets, while the other worries that the expansion of ETFs will amplify market linkage and herd behavior through the "common holding effect."
However, empirical data from the crypto market reveals a dynamic mechanism more complex than either of the above hypotheses. Taking Bitcoin as an example, we can divide its historical volatility into three intervals and compare them using the Realized Volatility (RV) as an objective indicator.
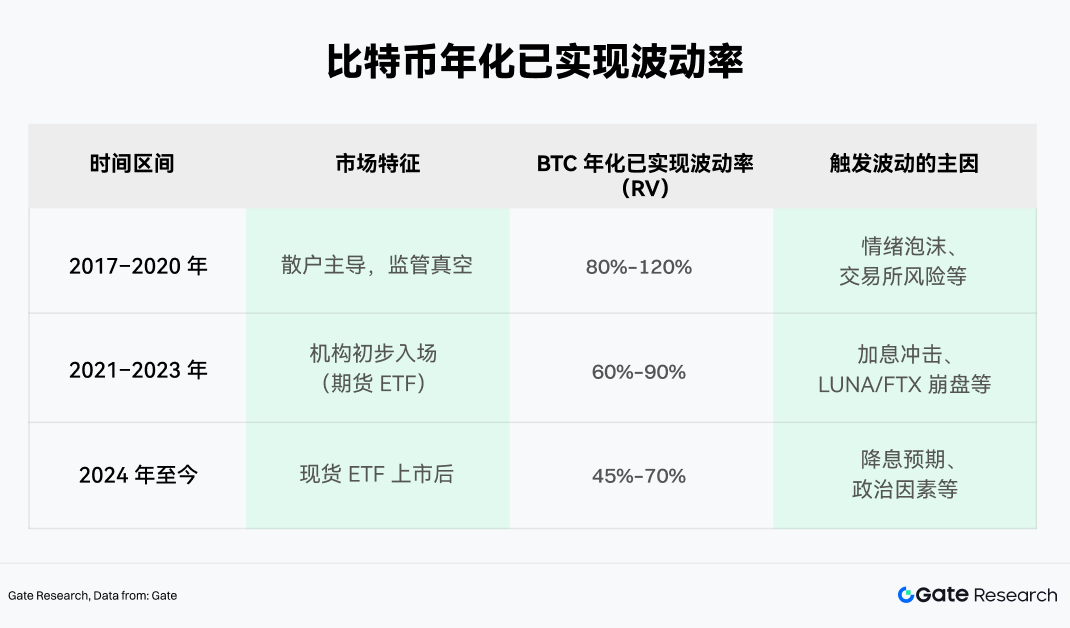
From the data, it can be observed that since 2024, the central tendency of Bitcoin's annualized realized volatility has somewhat declined. Although its absolute value remains high compared to the stock market, the peaks of volatility have been noticeably suppressed, and the mechanism behind this is the sustained presence of ETF arbitrage funds. Arbitrage funds facilitate faster mean reverts for extreme price deviations, while the seasonal inflow of institutional funds provides temporary support for prices.
Additionally, Bitcoin spot ETFs visibly buffer extreme volatility. During the market cycle from 2022 to early 2026, the maximum drawdown of Bitcoin from its peak to trough never exceeded 50%, a stark contrast to historical declines often exceeding 70% to 80%. This volatility contraction is akin to ETFs anchoring a portion of long-term capital that is less sensitive to price movements; when retail sentiment turns panic and starts to sell off, the ETF holdings in the hands of institutions serve as a "liquidity cushion," effectively absorbing the selling pressure.
2. Analysis of the Mechanisms and Characteristics of Crypto Market Leveraged ETFs
When arbitrage funds and institutional allocation capital became market mainstays, the overall market volatility indeed contracted significantly. Interestingly, this stability has also paved the way for more complex financial structures—especially as market risk appetite rises and capital begins to pursue higher yield elasticity; simple spot exposure is no longer sufficient to meet the demand. Thus, leveraged ETFs, with their emphasis on amplifying returns and volatility, began to enter the sight of crypto market investors.
Since the first Bitcoin leveraged ETF was approved in 2023, this sector has accelerated rapidly. Currently, leveraged products on the market can be roughly divided into two camps:
• Compliant ETFs regulated by the SEC, such as those issued by institutions like ProShares and Volatility Shares.
• Leveraged tokens issued by centralized exchanges (CEX), such as products like ETH5S and BTC3L.
On the path of compliant leveraged ETFs, BITX (a 2x Bitcoin ETF issued by Volatility Shares) currently holds the top position, with a management scale nearing $969 million. However, its management fee rate is also high at 2.38%. ProShares' BITU (also a 2x Bitcoin ETF) has a rate of 0.98% and an AUM of approximately $422 million.
It is worth noting that the leveraged tokens issued by CEXs have started to emerge in recent years, gradually gaining market attention. Compared to traditional ETFs, they possess structural advantages such as no margin requirements, no force liquidation, and the ability for direct spot trading, while also being more aligned with the demands of crypto native users regarding trading hours, coin listing speed, and strategy flexibility, thereby becoming an important tool connecting high-frequency trading and risk hedging.
2.1 Core Differences between Crypto Leveraged ETFs and Traditional Financial Leveraged ETFs
Although their operational mechanisms are similar, the uniqueness of crypto assets means that crypto leveraged ETFs face entirely different risk exposures compared to traditional products.
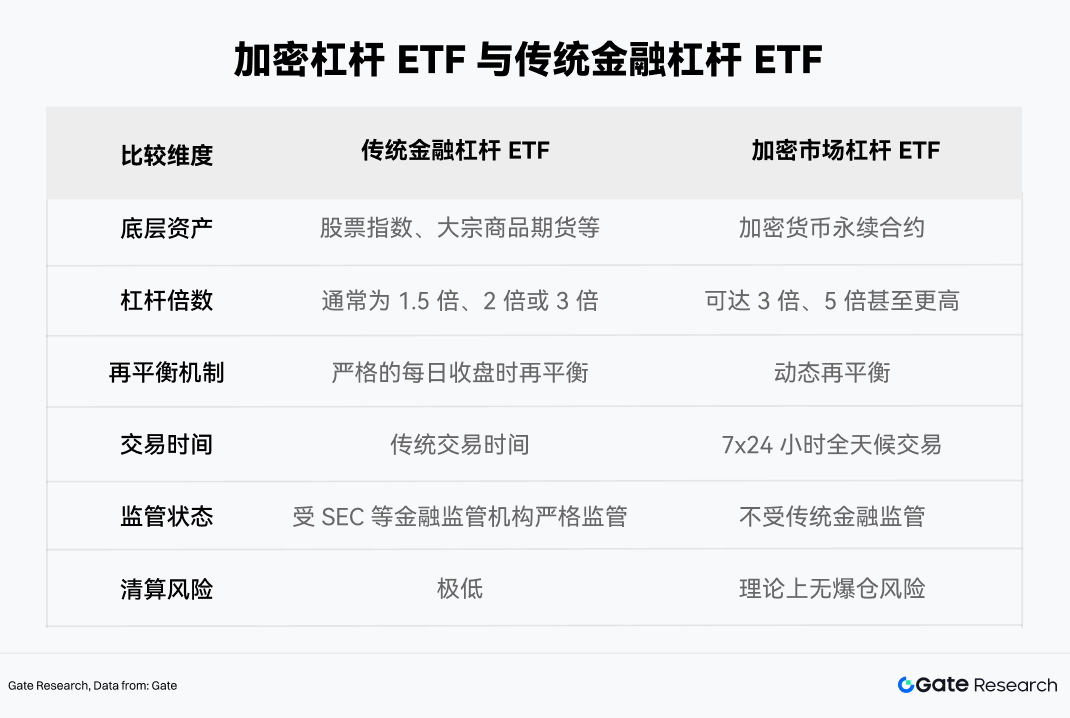
While both rely on rebalancing and derivatives positions to achieve leverage effects structurally, the characteristics of the crypto market—24/7 trading, high volatility, and a weak regulatory environment—lead to a risk profile for crypto leveraged ETFs that exhibits stronger non-linearity and tail amplification effects. At the same time, compared to traditional leveraged ETFs, crypto leveraged ETFs are more susceptible to "volatility decay," causing net asset values to shrink in continuous one-sided market trends, and in extreme cases, net values can even drop to zero.
2.2 Daily Rebalancing Mechanism and "Volatility Decay"
The "daily reset" feature of leveraged ETFs is what distinguishes them from ordinary leverage. To ensure that they can accurately provide the targeted asset exposure ratio at the opening of each trading day, funds must rebalance daily (Daily Rebalancing).
Many investors easily fall into the misconception that if “the underlying asset rises by 10%, a 2x ETF will rise by 20%.” This holds true for a single day; however, over multiple days, due to the compounded effects of daily rebalancing, the relationship becomes non-linear.
Specifically, if Bitcoin rises on day T, the net value of the 2x ETF also rises, causing the overall exposure ratio to be less than 2x, thereby requiring the fund to "chase the price" before the opening on day T+1 by buying more swaps or futures contracts; conversely, if Bitcoin falls on day T, the fund must “cut losses” and reduce its position. This mechanical operation of "chasing high and cutting lows" is the root cause of net value loss in volatile markets.
Assuming the underlying asset rises by 10% on the first day and then falls by 9.09% (exactly back to the starting point):
• Underlying Asset: $100 × 1.10 × 0.9091 = 100$ (0% return)
• 2x ETF: $100 × 1.20 × 0.8182 = 98.18$ (loss of 1.82%)
• 3x ETF: $100 × 1.30 × 0.7273 = 94.55$ (loss of 5.45%)
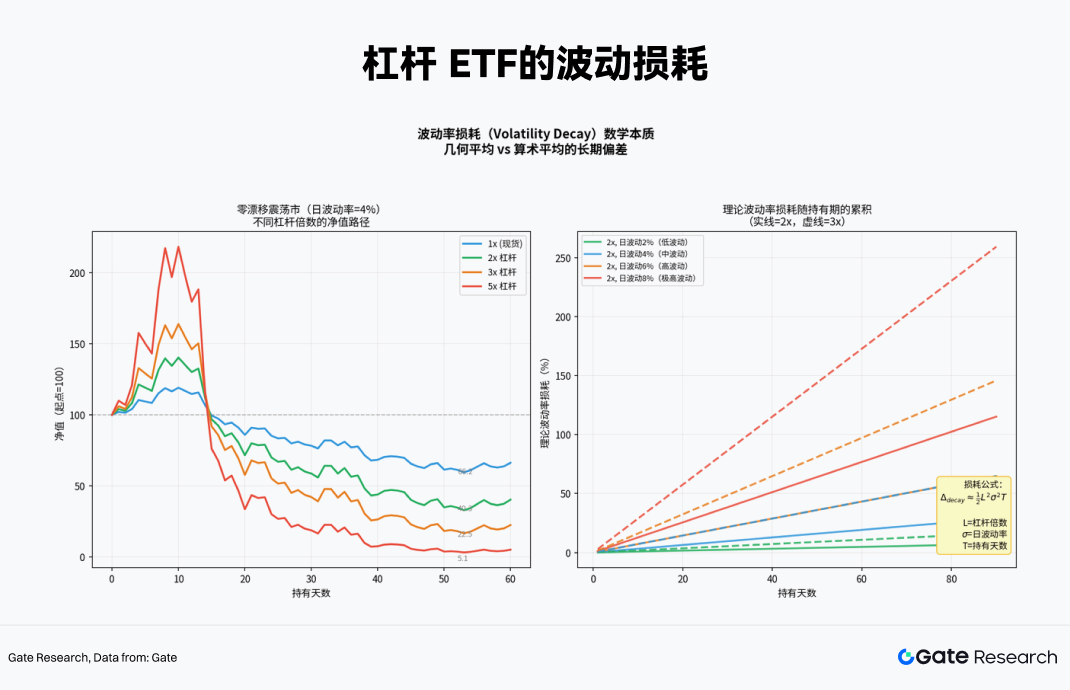
In a zero-drift (ultimately returning to the starting point) high-volatility oscillating market, the higher the leverage multiple, the longer-term loss will show exponential amplification. For instance, after 60 days, the net value of a 5x leveraged position may drop to just 5.1% of the original value.
2.3 Applicable Market Conditions for Crypto Leveraged ETFs
To determine market conditions suitable for crypto leveraged ETFs, we employ a 60-day rolling Monté Carlo simulation to characterize the performance differences of various leveraged multiple products under different market environments.
During the simulation, using the historical return rates and volatility of the underlying asset (in this case, ETH) as base parameters, numerous price paths are generated through random sampling, and for each path, daily compounding is used to calculate the net value changes of different leveraged ETFs (±1x, ±2x, ±3x, ±5x), while incorporating the mechanism of volatility decay, in order to arrive at the return distribution under different market structures. This approach allows for a more intuitive comparison of the long-term performance of different leveraged products in the same market environment.
The empirical results reveal that different leverage multiples exhibit significant differences in returns across three typical market conditions:
1. Unidirectional Trend Market: This is the only environment where leveraged ETFs can generate positive excess returns. Due to daily chasing of rising prices, their underlying positions continually increase, achieving compounding effects. In this situation, holding a 3x or 5x ETF's return far exceeds manually financing a 3x leveraged position (as the latter does not benefit from compounding).
2. High Volatility Oscillating Market: A "meat grinder" for leveraged ETFs. The underlying asset may stay at the same price after 60 days, but both the 5x long and 5x short ETFs may plunge by over 90%. Volatility decay completely consumes capital. The longer the holding period, the more certain the losses become.
3. Low Volatility Oscillating Market: Losses are present but relatively controllable. Sometimes -1x or -2x products can generate small positive returns due to minor trends or capital rate advantages, making them suitable for short-term event-driven hedging.

Therefore, the most favorable environment for crypto leveraged ETFs is a strong unidirectional trend. Additionally, to avoid the net value’s continual erosion in a fluctuating market, leveraged ETFs are more suitable for short-term tactical allocations rather than long-term core positions.
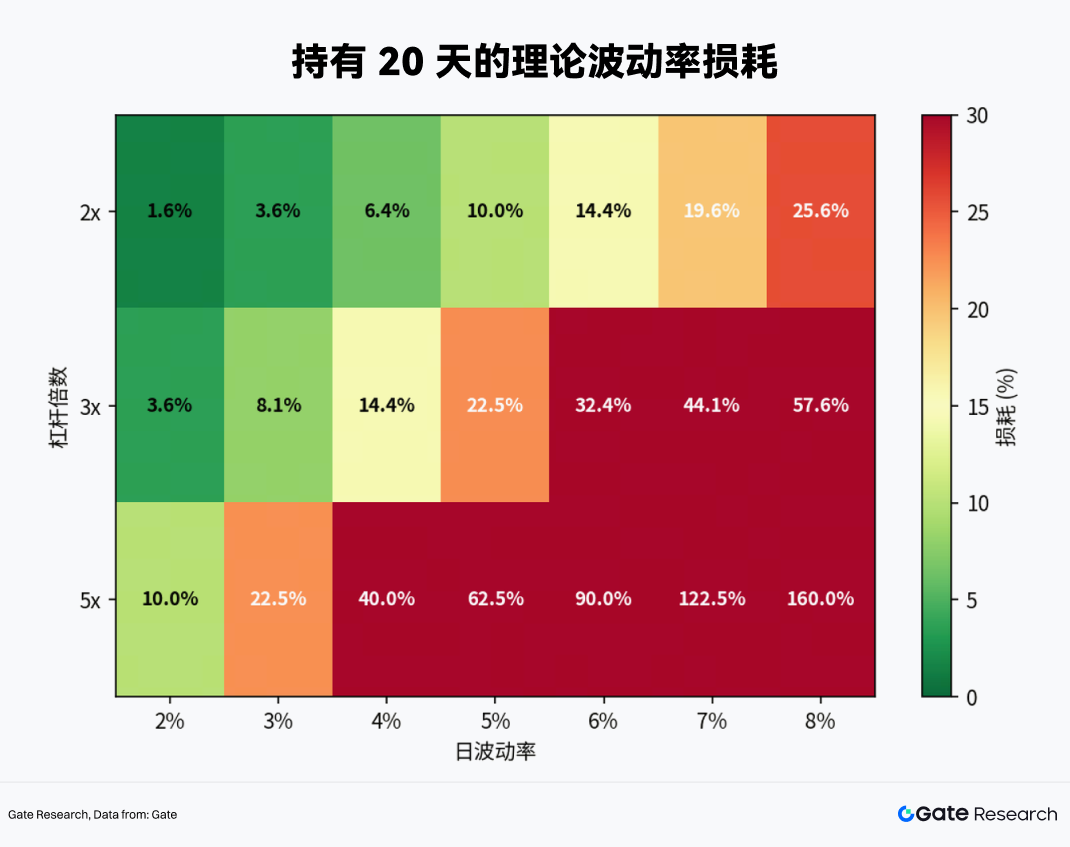
• When the daily volatility reaches 4% (the norm for the crypto market), the theoretical loss of a 2x ETF would reach 6.4% within 20 days, 14.4% for a 3x ETF, and as high as 40% for a 5x ETF.
• 30 days would be the threshold for survival, because unless the underlying asset experiences a very strong unidirectional upward trend, under normal volatility, 2x and 3x ETFs will essentially start to lose principal within 30 days.
Thus, the conclusion is straightforward: the holding period for crypto leveraged ETFs should never exceed 1 month, with the best tactical cycle being 1–5 days.
3. Practical Testing of Leveraged ETF Trading Based on Gate MCP
To apply the theory into practice, we accessed real-time data from the current crypto market through the Gate MCP interface and conducted a thorough analysis.
3.1 Selection of Underlying Assets
Liquidity is the primary prerequisite for the feasibility of leveraged ETF strategies. Products with too low trading volumes not only face slippage risks but their prices are also more likely to deviate from the net asset value, resulting in distorted strategy signals. Therefore, we extracted all trading volume data of leveraged ETF products from early 2026 to now (up to the end of March) via the Gate MCP interface, using this as the first filtering criterion for selection.
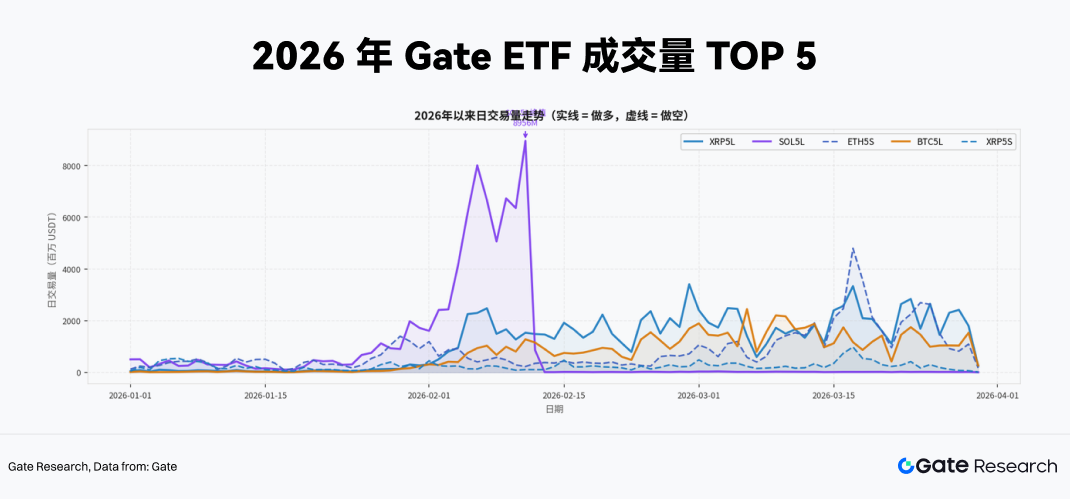
From the latest cumulative trading volume rankings, the absolute dominance of 5x leveraged products is evident. The Top 5 products (XRP5L, SOL5L, ETH5S, BTC5L, XRP5S) are all 5x leveraged products. This indicates that in the current crypto market environment, capital participating in leveraged ETF trading has a very high risk appetite, tending to utilize extreme leverage multiples to capture short-term volatility gains or engage in high-intensity spot hedging. Additionally, observing the daily trading volume trends shows that SOL5L experienced an extreme peak in daily trading volume of nearly 9 billion USDT in early February. Such liquidity pulses are often highly correlated with significant fundamental events of the underlying assets, representing a typical event-driven trading explosion.
In summary, when constructing actual trading strategies, we focused on these 5x leveraged products with daily average trading volumes reaching hundreds of millions of USDT. They provide entry depth and exit efficiency that other low-multiple or niche products cannot compare with, effectively absorbing the impact cost of large orders.
3.2 Dynamic Hedging and Momentum Breakout Strategy Design for High-Leverage ETFs
The greatest pain point for investors holding spot cryptocurrencies is how to protect their downside exposure cost-effectively and without liquidation risks during macro event shocks or technical breakdowns. Traditional solutions generally include three options: opening equal volume short positions in the perpetual contract market, buying put options, and converting into stablecoins.
However, each of these three solutions has distinct drawbacks. First, perpetual contracts require margin and carry the risks of forced liquidation due to price spikes; secondly, options bear high premiums in a high implied volatility environment; finally, converting to stablecoins means forfeiting potential upside returns altogether. Leveraged ETFs, such as XRP5L, SOL5L, and ETH5S, offer a fourth solution, which, under specific conditions, presents unique structural advantages:
• No margin requirements: Buying inverse ETFs is essentially spot trading, with the maximum loss capped at the initial principal, completely eliminating the common risk of "spike liquidation" in contract markets.
• Extreme capital efficiency: 5x leverage means that to hedge the same notional scale of spot exposure, only 20% of the capital is needed, while the remaining 80% can be allocated to other income-generating assets or retained as liquidity reserves.
• Precision of the hedge: For example, the actual correlation coefficient between ETH5S and ETH stabilizes between -0.91 and -0.97, indicating a high reliability of the hedging effect in the short term (specific verification to follow).
Based on the above analysis, we constructed the following trading strategy framework targeting high liquidity, high leverage (5x) crypto ETFs such as XRP5L, SOL5L, and ETH5S.
3.2.1 Entry Signal Design
One core risk of leveraged ETFs is the rapid erosion of net value caused by incorrect directional judgments, thus right-side positioning is the first principle of strategy design. Before trading, relevant buy signals can be established; for instance, on the eve of macro events such as Fed resolutions or non-farm payroll data releases, or when the crypto spot price rises above or falls below key support levels (like the 20-day moving average), and the volatility indicator (like the 7-day annualized volatility) begins to turn, buy the corresponding leveraged ETF asset.
For instance, to use 5x short ETFs for hedging or speculation, the following three resonance conditions must be met:
1. Technical Breakdown: The underlying asset (such as ETH or SOL) closes below the 20-day simple moving average (SMA) on a daily basis, with a deviation exceeding 2%.
2. Sentiment Volatility: The 7-day annualized realized volatility of the underlying asset sharply increases compared to the previous week (e.g., an increase exceeding 15%), indicating a rise in market sentiment and attention.
3. Fund Turnaround in Contracts: From the short perspective, if the perpetual contract funding rate is positive for three consecutive days, indicating that longs are still paying the rate, it suggests that the longs have not fully deleveraged, and there is a potential for long squeezes in the future; the opposite holds true for the long side.
In terms of position building, on the first day of signal activation, only 50% of the target position is established and if the downward trend is validated before the close the next day, the position is then supplemented to 100%, avoiding being lured by false breakouts.
3.2.2 Momentum Breakout Detection
In addition to structural hedging, high-leverage ETFs themselves are also powerful tools for capturing extreme one-sided trends. As demonstrated by the high trading volumes of SOL5L in early February, when significant events occur in the market, high-leverage ETFs can provide astonishing excess returns.
The core signal of the momentum breakout strategy derives from the abnormal surge in the trading volume of the ETFs themselves because, during genuine extreme market movements, capital flows usually lead price indicators:
• Trigger Conditions: When the daily trading volume of a particular 5x ETF exceeds three times its 20-day average trading volume, and the price simultaneously breaks through recent oscillation ranges or resistance lines.
• Position Management: Such speculative operations are advised to be strictly controlled within 15%-20% of the total strategy capital.
• Profit-loss Ratio Setting: Based on the characteristics of high leverage, a hard stop-loss level must be set immediately upon entry (such as -15% of the entry net value). In a strong trend, a 5x ETF achieving 30%-50% gains in a short term is commonplace, forming a favorable asymmetric profit-loss ratio.
3.2.3 Strict Exit Mechanisms
For leveraged ETFs, the design of exit mechanisms is as crucial as the entry signals. The unique volatility decay effect of leveraged ETFs means that holding time itself incurs a cost—every time a price retraces (rising then falling, or falling then rising), net values experience irreversible depletion. Therefore, holding positions while waiting for trends to clarify is one of the most dangerous behaviors in leveraged ETF trading.
1. Time Stop-loss: The holding duration for a single ETH5S position must not exceed 5 calendar days. Regardless of current profit or loss, positions that exceed this period are forcibly liquidated. The logic behind this rule is that after 5 days, if the market has not developed as expected, the original entry logic has likely broken down; if the market enters a volatile consolidation, volatility decay will accelerate in the 6th to 10th days. The time stop-loss serves as the most effective countermeasure against human "loss aversion" psychology.
2. Trailing Stop-profit: The core of the trailing stop-profit is to set a safety net for profits. In a strong trend market, ETH5S might achieve short-term increases of 50%-80%; the trailing stop-profit mechanism ensures that the strategy can retain part of the positions to continue participating as trends persist while quickly monetizing profits when trends reverse. Specifically, when the ETH5S position reaches a profit of +20%, the trailing stop-profit mechanism is activated. If the profit is +20%, 50% of the position is reduced, locking in partial profits, while the remaining position's take-profit line is raised to +10%. If the position increases by +40% on top of this, then another 25% is reduced, bringing the total position down to the initial 25%, and the take-profit line on the remaining position is raised to +25%. Moreover, if the price retraces from the highest profit point by more than 15%, it triggers a total take-profit closure of the remaining position.
3.3 Asymmetrical Hedging and Momentum Breakout Testing with ETH5S
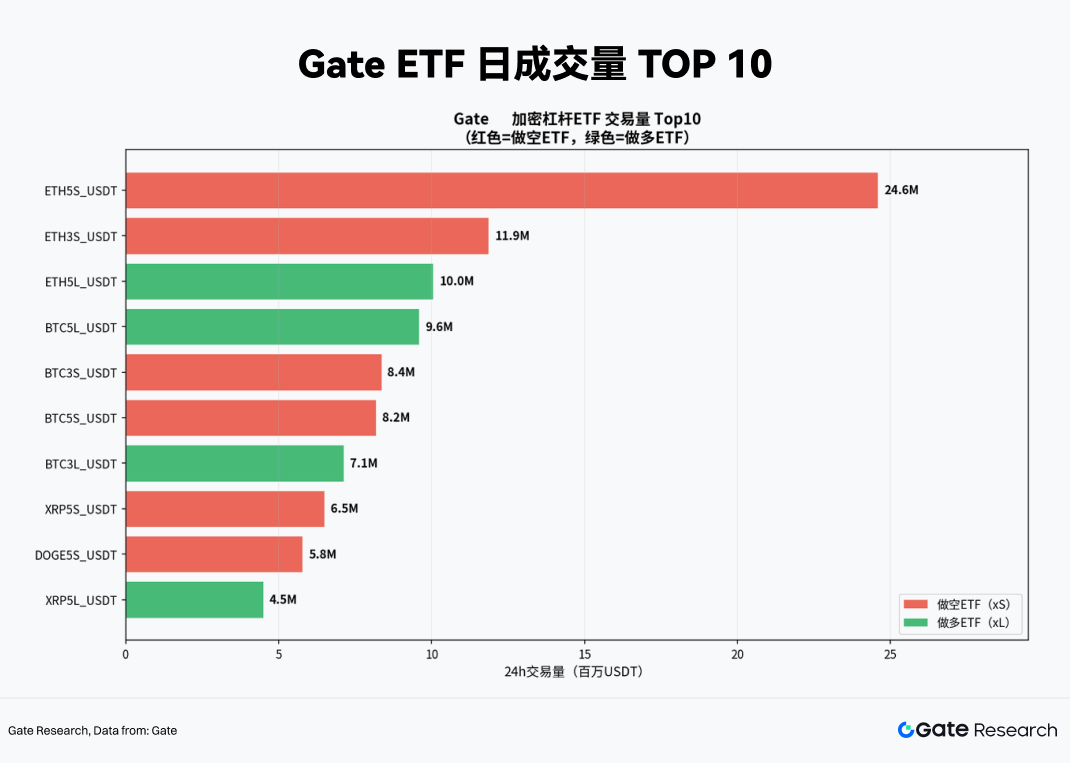
Based on the strategy designs outlined above, the next step is to select an ETF for practical testing. From the recent trading volume distribution (March 19, 2026), ETH5S shows a dominating liquidity advantage, with a single-day trading volume of 24.6 million USDT, ranking first and serving as the main battleground for short-term capital speculation. The stark liquidity differences compared to the second to tenth positions indicate that ETH5S possesses features other products cannot match in terms of entry depth and exit efficiency, effectively controlling the impact costs of large orders. Combined with this analysis, we have chosen ETH5S as the core strategic asset.
3.3.1 Asymmetrical Hedging with ETH5S
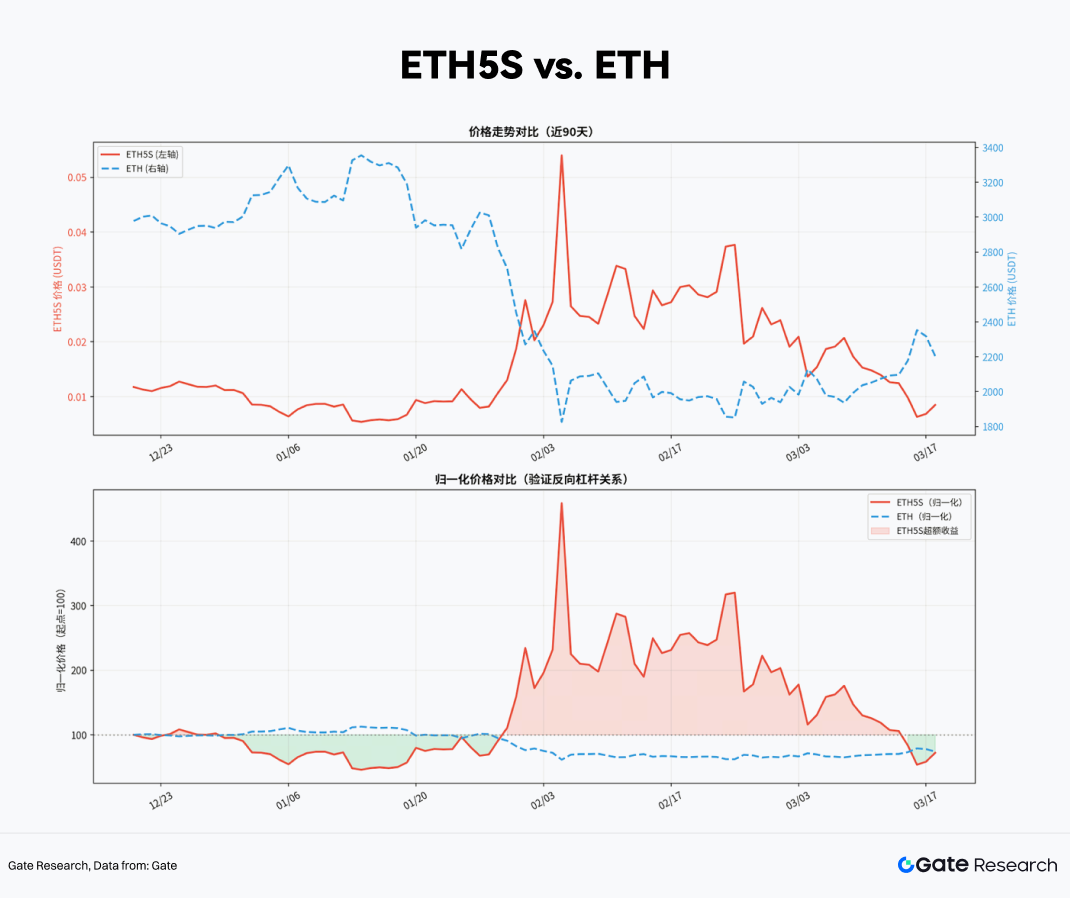
First, we empirically validate the ETH5S product mechanism by extracting the 90-day daily data for ETH5S and ETH spot from December 2025 to March 2026 through the Gate MCP interface.
Using the starting point of the observation period (price = 100) as a benchmark, we normalize the prices of the two over 90 days, allowing us to visually observe the mirror relationship of their relative rise and fall. During major downturns for ETH spot, such as the approximately 14% drop due to macro data shock in mid-February 2026, ETH5S correspondingly generated approximately 65% net value increase during the same period—this number is below the theoretical maximum of 5×14% = 70%, with the difference mainly arising from volatility decay and management fees.
Overall, ETH5S proves to be a reliable hedging tool at the product mechanism level, without the risk of excessive tracking errors leading to ineffective hedges.
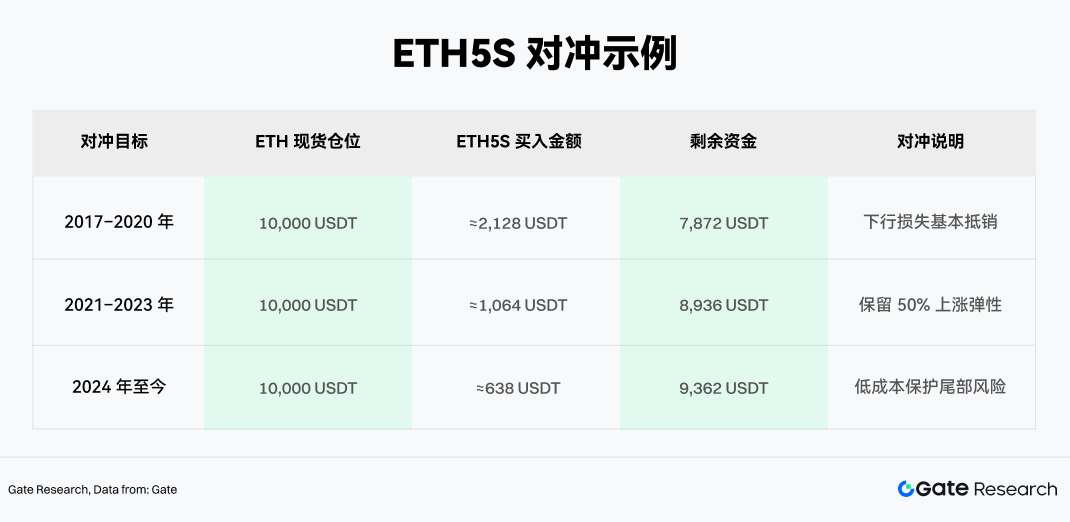
Considering the specific hedging proportions in practical operations, we hypothesize a holding of 10,000 USDT worth of ETH spot, with a target hedging ratio of 100% (i.e., completely hedging downside risks). The precise hedging ratio can be deduced using the following formula:
ETH5S Purchase Amount = ETH Spot Position Market Value × Hedging Ratio ÷ Actual Leverage Elasticity β
Where the actual leverage elasticity β, influenced by factors like decay, is slightly less than the theoretical leverage of the product, set at -4.7 based on recent averages. Thus, if using ETH5S for risk hedging, we arrive at the following result:
3.3.2 Backtesting the Momentum Breakout Strategy for ETH5S
Based on the structural hedging position, if momentum breakthroughs can capture extreme market movements, it could result in objective excess returns in a short period. The core signal for this approach arises from the abnormal surge in ETH5S's trading volume—considering that in genuine panic sell-off situations, volume often leads price confirmation.
Therefore, we set the following as entry signals: When the daily trading volume of ETH5S exceeds three times its 20-day average trading volume, and the price simultaneously breaks through recent descending trend lines (indicating that short selling momentum is accelerating), this is regarded as a stage maximum signal of market panic sentiment, and additional short-term speculative positions may be added on top of existing hedging positions.
Historical backtesting of this signal (based on Gate MCP data from January 2024 to March 2026) shows:
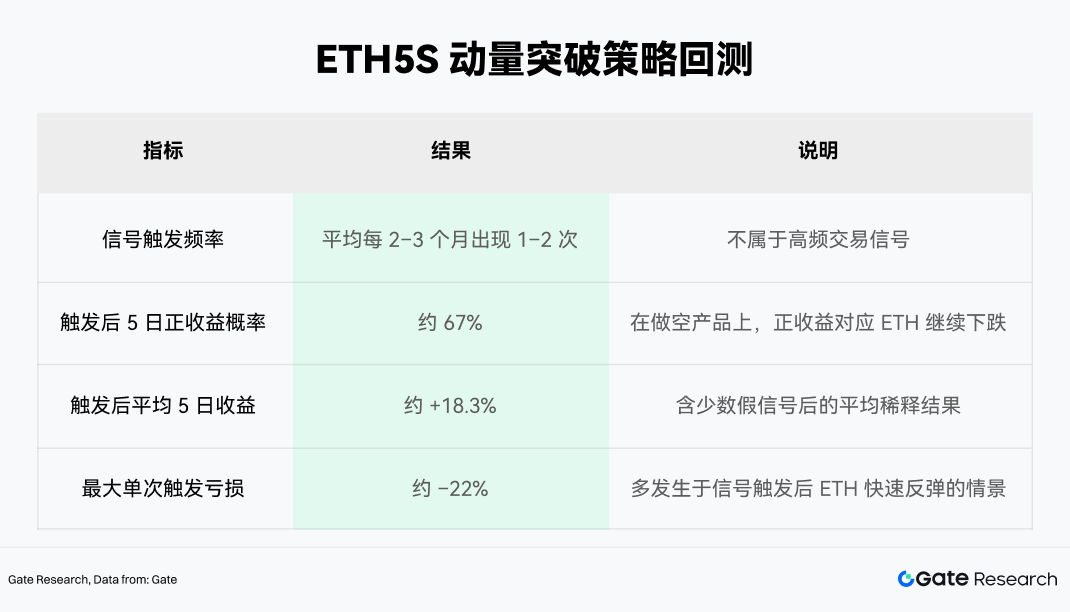
Based on the backtesting results, the momentum breakout module recommends an upper limit of 15%-20% of total strategy capital for speculative additions and setting stop-loss levels immediately upon triggering (recommended at -15% of entry net value). The expected profit from this module (i.e., an average of +18%) and the loss limit (i.e., -15% stop-loss) form an approximate expectation ratio of 1.2:1, which, when multiplied by a 67% win rate, results in a positive theoretical expectation.
4. Conclusion
The rise of crypto ETFs has not only injected unprecedented liquidity into the market but fundamentally altered the market structure and volatility characteristics of crypto assets. The accumulation of institutional funds has caused the volatility of mainstream assets such as Bitcoin to exhibit a long-term convergence trend. In this context, leveraged ETFs provided by centralized exchanges, as a high-leverage tool that does not require margin, demonstrate unique tactical value in unidirectional trends and tail-risk hedging.
However, investing in crypto leveraged ETFs is not a generic tool for amplifying returns but a precision instrument that requires calibrated usage conditions. Under the right market states, it can establish a robust risk hedging system with minimal capital usage; under incorrect holding logic, its self-consumption rate of net value can also be shockingly fast.
Based on the selection of Gate MCP data, we have developed a trading strategy centered on "entering from the right side,” using volume-driven momentum breakout signals to capture excess returns. The core of execution lies in phased position building, increasing momentum, and a strict exit mechanism, maintaining a dynamic balance between risk and return while controlling the losses from volatility.
With significant liquidity advantages and stable negative correlation characteristics, ETH5S has been validated as an efficient and reliable hedging tool, achieving precise asymmetrical risk hedging with lower capital usage. By introducing momentum signals based on "volume amplification + trend breakout," it can capture short-term excess returns during extreme declines, showing about a 67% win rate and positive expected returns in historical backtesting. By controlling the momentum strategy position at 15%-20% and combining it with strict stop-loss measures (-15%), the overall strategy achieves a dynamic balance between hedging protection and return enhancement while managing drawdown.
Looking ahead, the institutionalization process of the crypto market is far from over. With more sovereign wealth funds, insurance capital, and pension systems progressively incorporating crypto asset allocations, the market structure will experience deeper evolution: volatility centers may further decline, liquidity premiums will continue to compress, and macro-linked pricing logic will increasingly dominate short-term price behavior. The effectiveness window of crypto leveraged ETF strategies might narrow, the signal noise will become harder to identify, but simultaneously, the reliability of the mechanism itself will enhance with the increase in market depth.
Strategies that can maintain competitiveness amid this evolution will inherently be those that internalize strict risk discipline into operational instinct, embed real-time data analysis into decision-making processes, and always maintain a reverence for the market, rather than any static set of rules. Markets will change; tools will iterate; only a deep understanding of the underlying mechanisms will allow one to find new footholds during each structural transformation.
References
•ARK Invest, https://www.ark-invest.com/articles/analyst-research/bitcoins-evolving-institutional-role
•Volatility Shares, https://www.volatilityshares.com/bitx
•ProShares, https://www.proshares.com/our-etfs/leveraged-and-inverse/bitu
•Gate, https://www.gate.com/trade/ETH5S_USDT?type=etf
Disclaimer
Investing in the cryptocurrency market involves high risks. Users are advised to conduct independent research and fully understand the nature of the assets and products before making any investment decisions. Gate is not responsible for any losses or damages resulting from such investment decisions.
Gate Research Institute is a comprehensive research platform for blockchain and cryptocurrency, providing readers with in-depth content including technical analysis, hot insights, market reviews, industry studies, trend predictions, and macroeconomic policy analysis.
免责声明:本文章仅代表作者个人观点,不代表本平台的立场和观点。本文章仅供信息分享,不构成对任何人的任何投资建议。用户与作者之间的任何争议,与本平台无关。如网页中刊载的文章或图片涉及侵权,请提供相关的权利证明和身份证明发送邮件到support@aicoin.com,本平台相关工作人员将会进行核查。