Dear friends, I am Sister Qinglan. Today’s market has quite a bit of information. First, let’s highlight two major points. The first point is that the three major U.S. stock indices have reached a new historical high, Intel has surged, risk appetite has increased, which indirectly benefits the cryptocurrency market. But don’t celebrate too early. The second point is that gunfire sounds have been reported in the Strait of Hormuz within two hours, escalating the conflict between the U.S. and Iran, which directly suppresses risk assets due to geopolitical risks. At the same time, Bitcoin ETFs saw a net outflow of 2022 BTC in a single day, and Ethereum ETFs saw an outflow of 34,000 ETH, indicating institutional funds are withdrawing. One side shows the emotional rebound brought by new highs in U.S. stocks, while the other side sees geopolitical conflict and capital outflows as bearish pressure; the market is now at a crossroads of long and short positions. We must let the data speak and not be swayed by emotions.
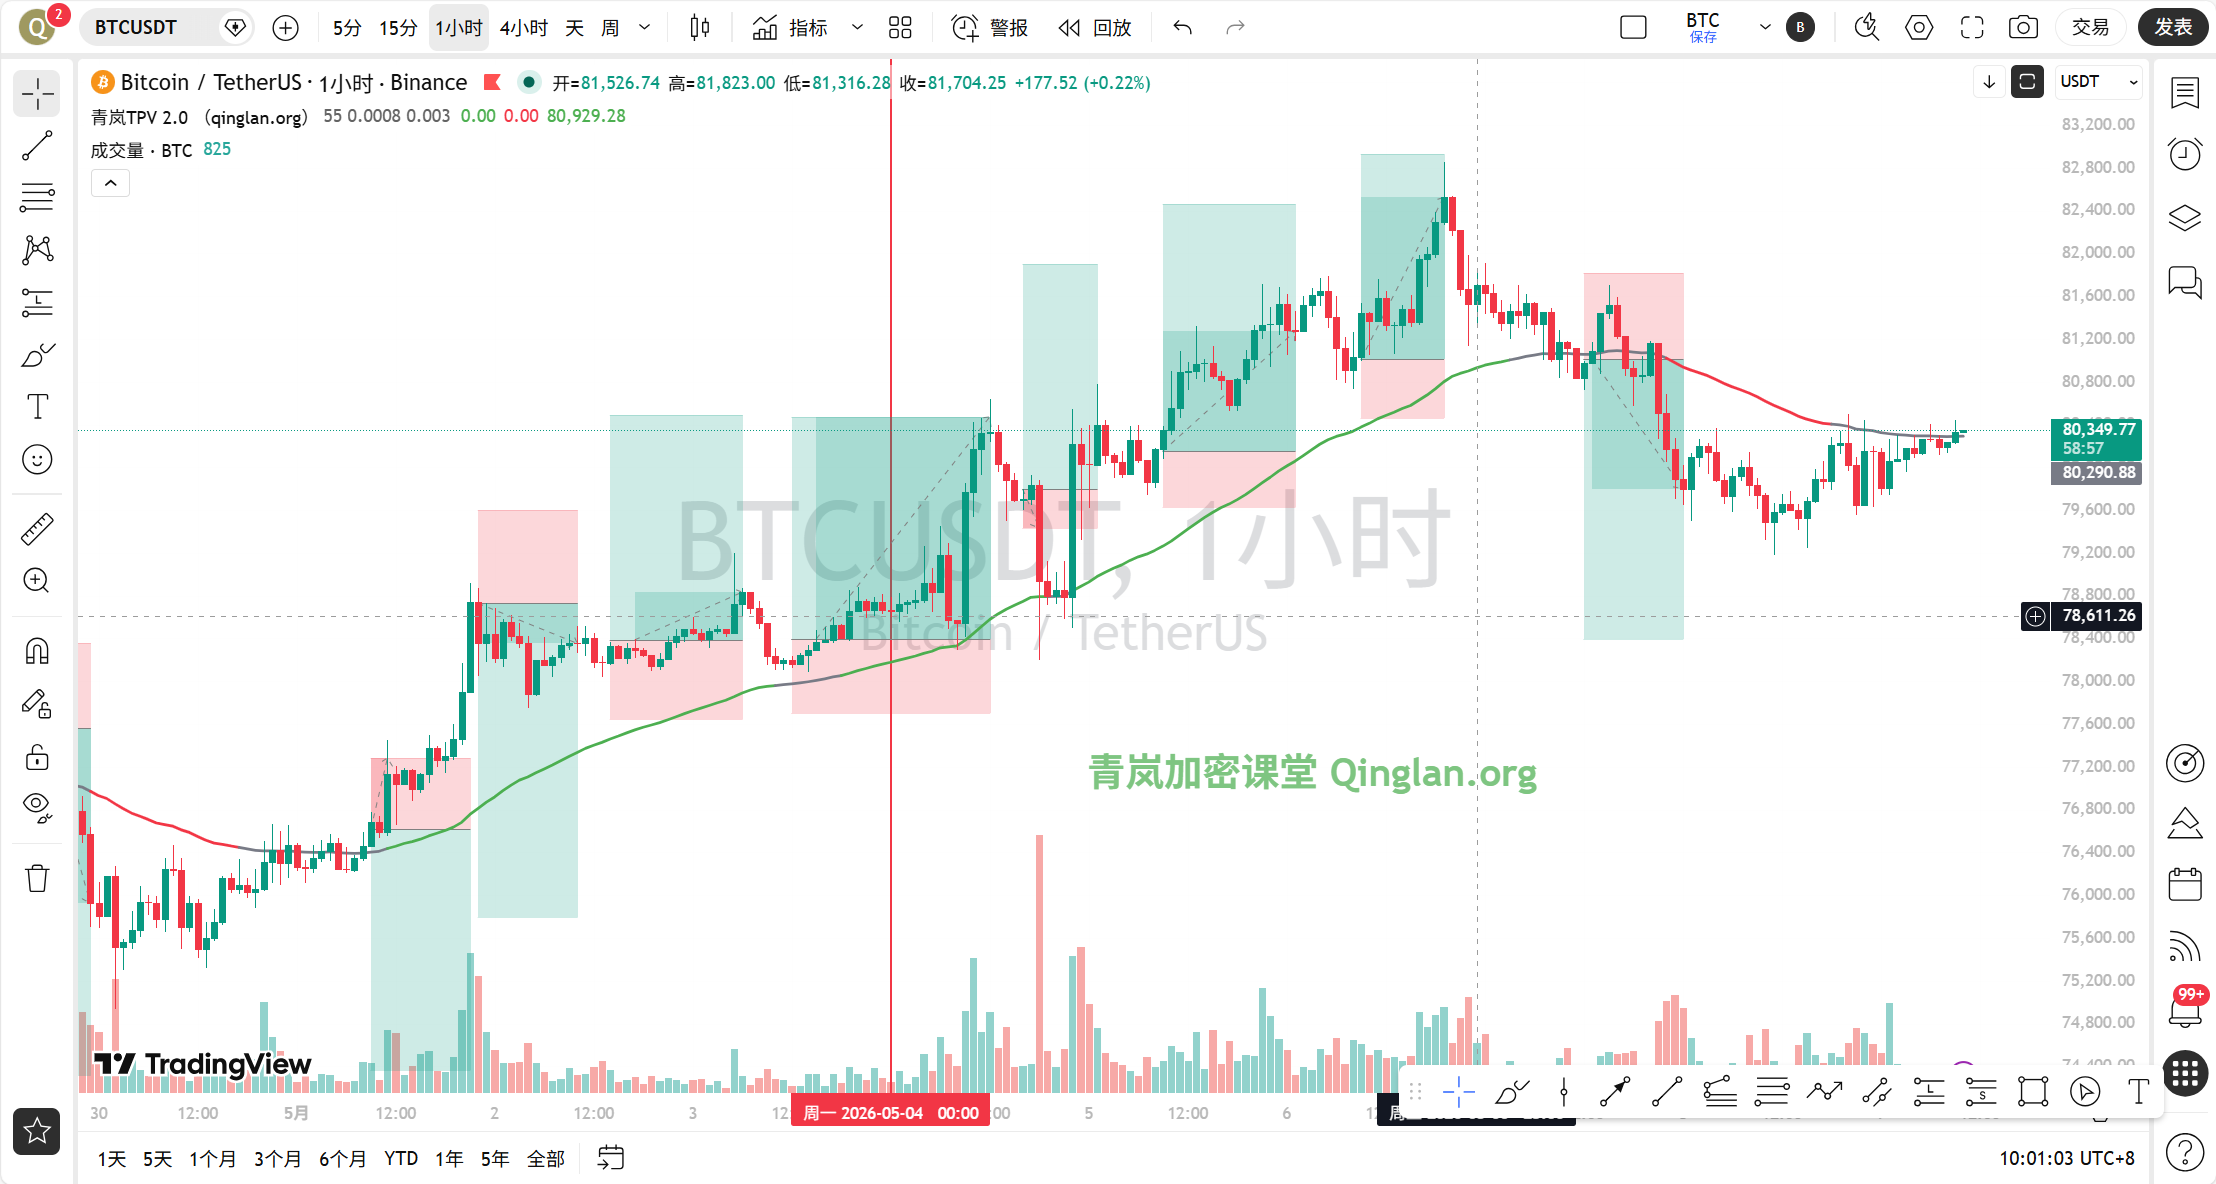
Current Price and Time
The time is 10:00 on May 9th, with the latest BTC price at 80,350 USDT. The 24-hour change is only 0.23%, with little volatility, but the funding rate is generally bearish, and market sentiment is leaning towards fear, with the Fear and Greed Index at only 38. This position is quite delicate; it is neither up nor down, testing patience and discipline.
Multi-Timeframe Overview
Let’s first look at the daily chart. MA5 is at 80,580, MA10 at 79,459, and MA30 at 76,941; short-term moving averages are still in a bullish alignment, but MA5 has flattened. The MACD’s DIF is at 1,858, DEA at 1,835, and the histogram is at 22.84, indicating that momentum is still present, but obviously waning. RSI is at 61.75, not overly hot nor oversold. Overall, the daily chart is biased towards bullish, but the upward momentum is weakening.
On the 4-hour level, there are some issues. MA5 is at 80,219, MA10 at 80,040, MA30 at 80,631; the short-term moving average has crossed below the long-term moving average, forming a dead cross. MACD’s DIF is at 40.09, DEA at 183.13, and the histogram at -143.04, with bearish momentum continuing to be released. RSI is only at 38.17, entering a weak area. The 4-hour chart is clearly dominated by bears.
On the 1-hour level, MA5 is at 80,274, MA10 at 80,208, MA30 at 79,960; the short-term moving averages are merging upwards, but EMA55 is at 80,372, with the current price at 80,350, just slightly below EMA55. MACD’s DIF is at 39.33, DEA at -20.07, and histogram at 59.41, with bullish momentum still present, but RSI at 58.05 is neutral to weak.
On the 15-minute level, MA5 is at 80,330, MA10 at 80,259, MA30 at 80,221; short-term moving averages are in a bullish arrangement. MACD’s DIF is at 50.64, DEA at 43.54, histogram at 7.10, and RSI at 52.88, showing short-term signs of rebound, but the force is not strong.
To summarize, the daily chart is biased towards bullish but with weakening momentum, the 4-hour chart shows bearish dominance, and the 1-hour and 15-minute charts are in corrective fluctuations. The different directions across multiple timeframes indicate typical consolidation in a choppy market.
TPV Signal Verification
Now let’s use the Qinglan TPV system for verification. The core rule is that the 1-hour EMA55 serves as a boundary for long and short positions; the current EMA55 is at 80,372, and the price is at 80,350, sitting below EMA55. However, note that the auxiliary oscillation data shows that in the past 8 1-hour candlesticks, the number of closing prices greater than EMA55 is 0, and the crossing frequency is also 0. The price distance from EMA55 is only 0.03%, indicating line-bound fluctuations. Although it does not meet the oscillation threshold, line-bound fluctuations imply direction is unclear and increase the probability of oscillation.
According to the TPV system, the current price is below EMA55, indicating a bearish trend area. However, the shorting condition requires two consecutive 1-hour candlesticks to close below EMA55, and the first one has not been confirmed yet. Meanwhile, the long condition requires the price to stabilize above EMA55, which is also not satisfied. Thus, the TPV system currently shows no clear entry signals and is in a wait-and-see state.
Now looking at the patterns. On the 1-hour level, the price is repeatedly testing nearby EMA55, with no obvious top or bottom formations. In terms of momentum, the MACD histogram is positive on the 1-hour level but negative on the 4-hour level, with no resonance between bullish and bearish momentum. RSI is at 58 on the 1-hour and 38 on the 4-hour, with no extreme values present. Therefore, the conclusion given by the TPV system is that the current situation is in consolidation; do not actively long or short, just give a range.
On-Chain / Capital Flow
In on-chain data, the Fear and Greed Index is at 38, belonging to the fear zone, indicating a pessimistic market sentiment. The funding rates are generally bearish, with both major CEX and DEX funding rates being negative, increasing short-term downward pressure. In the past 24 hours, a total of 188 million USD was liquidated across the network, resulting in a dual wipeout of long and short positions, indicating violent fluctuations and fragile sentiment. Fidelity deposited 23,919 Ethereum into Coinbase Prime, while a whale sold 78,000 ETH to Binance, indicating that institutions and large holders are reducing their holdings. Bitcoin ETFs and Ethereum ETFs are both experiencing net outflows, clearly showing that institutional funds are withdrawing. All these data point towards a bearish bias in the short term.
Key Resistance and Support Levels
The first resistance level above is at the 1-hour EMA55 of 80,372; if it breaks and holds above, the next resistance level is at the 4-hour MA30 of 80,631, followed by the daily MA5 at 80,580. The first support level below is at the 1-hour MA30 of 79,960, then at the 4-hour MA10 of 80,040; if it breaks, the next support is at the daily MA10 of 79,459. If 79,459 cannot hold, we will have to look at the daily MA30 of 76,941. The current price is at 80,350, sitting right between resistance and support, making the direction unclear.
Trading Thoughts
Based on the signals from TPV system and the current multi-timeframe state, my trading thought is: primarily waiting, awaiting clearer signals.
Direction: Currently no clear direction; do not actively long or short.
Entry Conditions: If the price breaks and holds above the 1-hour EMA55 of 80,372, and two consecutive 1-hour candlesticks close above EMA55 while the MACD histogram shortens consecutively for 2 cycles and RSI rebounds from 58, a light long position can be entered. If the price breaks below the 1-hour MA30 of 79,960, and two consecutive 1-hour candlesticks close below EMA55 while the MACD histogram shortens consecutively for 2 cycles and RSI falls back from 58, a light short position can be entered.
Stop Loss: The stop loss for long positions is set below 79,900, while the stop loss for short positions is set above 80,650.
Target Levels: For long positions, the initial target is 80,631, and then 81,000. For short positions, the initial target is 79,459, and then 79,000.
Risk Warning
Currently, the market is highly contested between long and short positions, with geopolitical risks and capital outflow suppressing it, but the new highs in U.S. stocks and expectations of regulatory easing provide support; short-term fluctuations may be amplified, and it is crucial to control position sizes and strictly implement stop losses.
Follow the Qinglan Crypto Classroom to seize more trading opportunities together! Welcome to visit the official website www.qinglan.org
📊 Qinglan TPV Trading Strategy Backtest Reference
🕒 Last Backtest Time 05-09 07:00:01
Total Analysis: 1399 Backtests: 1393 Accuracy Rate: 67% (934/1393)
免责声明:本文章仅代表作者个人观点,不代表本平台的立场和观点。本文章仅供信息分享,不构成对任何人的任何投资建议。用户与作者之间的任何争议,与本平台无关。如网页中刊载的文章或图片涉及侵权,请提供相关的权利证明和身份证明发送邮件到support@aicoin.com,本平台相关工作人员将会进行核查。