On Wall Street, "TACO trading" is obsolete, and now everyone is starting to discuss a new trading model - "NACHO".
Since the US and Israel airstrikes on Iran on February 28, the Strait of Hormuz has not reopened. Currently, oil prices have risen over 50% compared to pre-war levels, and the Fed's expectation of interest rate cuts in 2026 has been reduced from 2 before the war to 0 now. Yet at the same time, the S&P 500 has set a historic high, increasing for 6 consecutive weeks, marking the longest winning streak since 2024.
Wall Street has given this seemingly contradictory market state a name: NACHO, which stands for "Not A Chance Hormuz Opens," indicating that there is no possibility of the Strait of Hormuz reopening. It is the antonym of TACO (Trump Always Chickens Out). TACO bets on the idea that "people will chicken out," that Trump will back down at critical moments. NACHO bets on the idea that "things will stagnate," that Hormuz cannot be reopened with just a Truth Social post.
eToro market analyst Zavier Wong describes this transition: "During most of the crisis, every ceasefire headline led to a sharp drop in oil prices, as traders continuously bet on a solution that never arrives. NACHO means the market acknowledges that high oil prices are not a one-time shock, but rather the nature of the current market environment itself."
Two Lines in Early April
March 23 was the critical point of the TACO model's failure. On that morning, Trump announced on Truth Social that he had a "very good constructive dialogue" with Iran and ordered the Pentagon to pause strikes on Iranian energy facilities for 5 days. S&P 500 futures bounced nearly 4% from their lows within minutes, adding $1.7 trillion in market value instantly. Brent crude dropped from $109 to $92 during trading.
Then Iran officially denied the existence of the dialogue. According to Iranian state media, a "senior security official" stated that this was a means of market manipulation, and that the dialogue never happened. The gains were halved within two hours, with the S&P closing only +1.15% and Brent rebounding to $99.94.
This was the first time in 14 months that Trump's "backing down" was no longer effective on the market. The reason is straightforward; under the TACO model, backtracking is unilateral and can be validated with a single post. The backtracking on March 23 required cooperation from Iran. When the opponent does not cooperate, backing down becomes a lie.
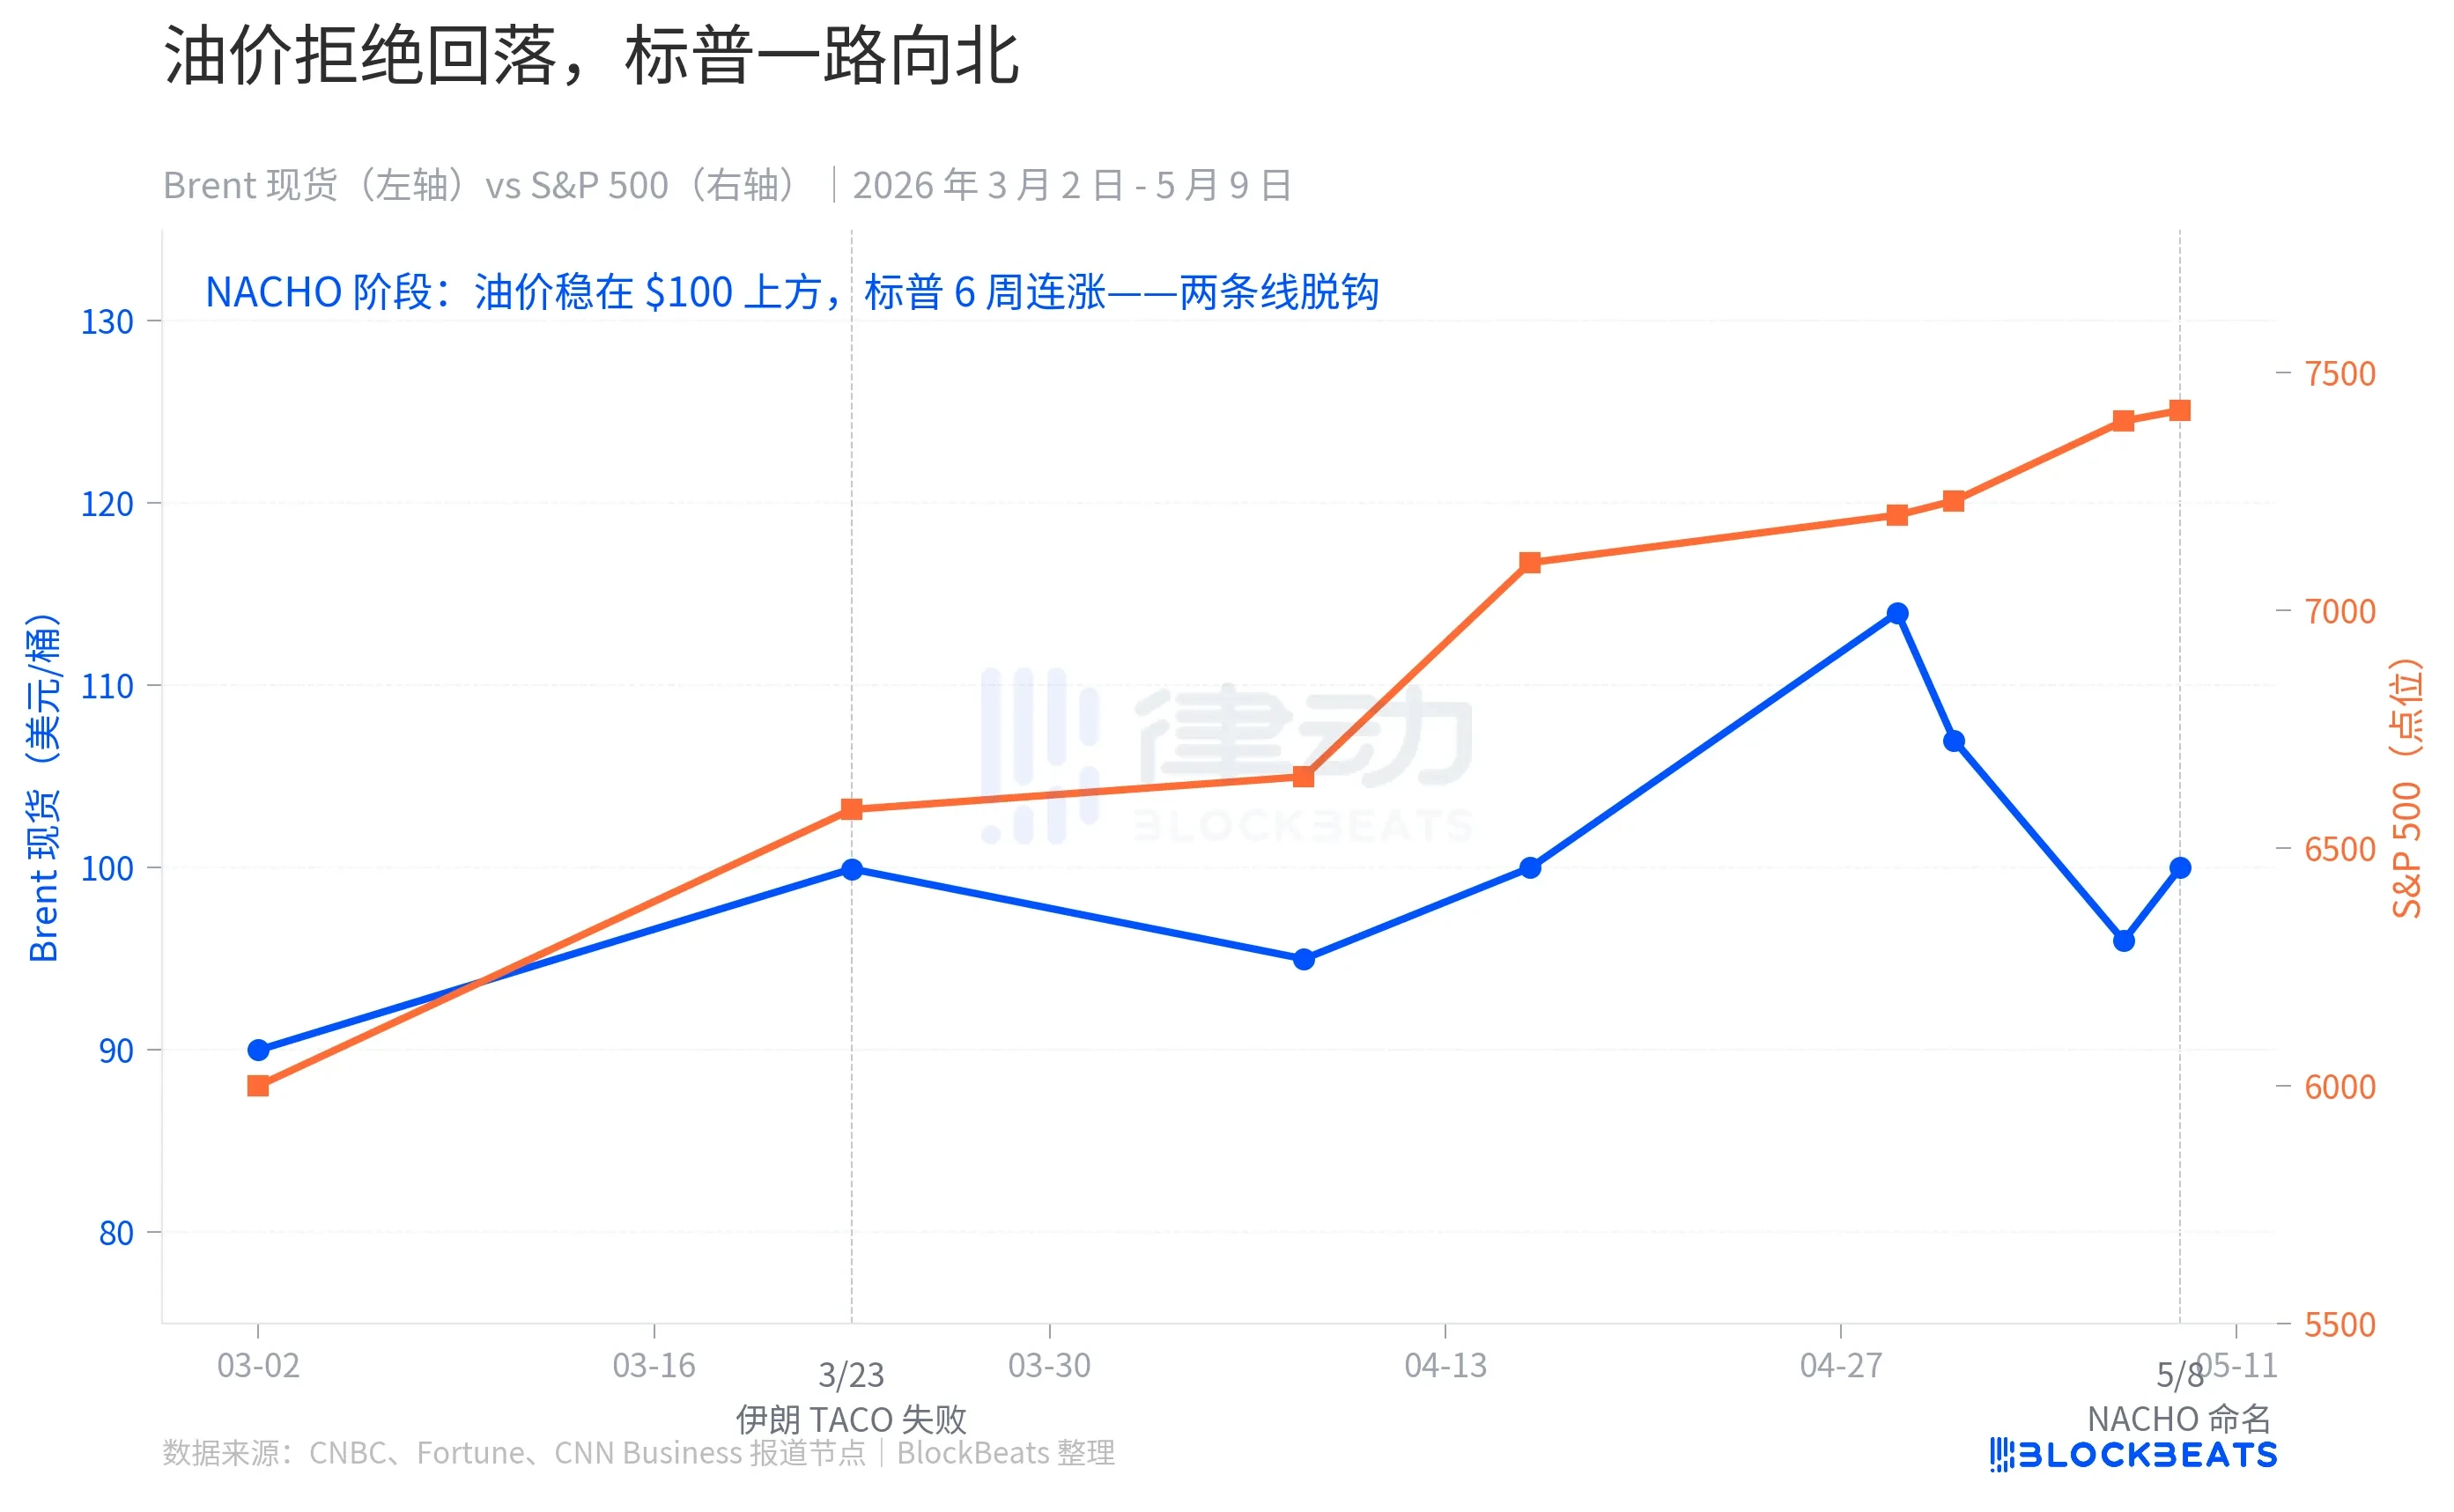
From that day on, market behavior underwent a fundamental change. Brent crude never returned to pre-war levels of $67 in the following 6 weeks; the average price in May remained at $109.57. There were the US-Iran ceasefire agreements on April 7 and 8, oil prices temporarily returning to "initial war levels" on April 17, and news of the US and Iran nearing an agreement on May 7; yet each "ceasefire headline" failed to bring oil prices back to baseline levels.
But the S&P kept moving north. April saw a monthly increase of 10%, the strongest month since November 2020, witnessing 7 intraday historical highs during that time. On May 1, it broke 7,230 points intraday, and on May 7, it closed at 7,398 points.
The two lines completely decoupled in early April. During the TACO era, they moved in the same direction, threatening to drop oil prices and the S&P, while backing down caused oil prices and the S&P to rebound. In the NACHO era, they express two different narratives; oil prices say, "The Strait of Hormuz is closed," while the S&P says, "It doesn't concern me."
Three Markets, Three Reactions
NACHO is not just talk; it is the same bet made in real money across three independent derivatives markets.
The first layer is insurance. According to historical data from the Strauss Center, the war risk premium for the Strait of Hormuz soared to 3.5% of the vessel's value during the US invasion of Iraq in 2003, and peaked at 7.5% during the "Tanker War" of the Iran-Iraq War in 1984 after the attack on the Yanbu Pride tanker. The baseline before this crisis was between 0.125% and 0.25%. By early May, this rate had reached the range of 1%, with some insurance types spiking to between 3% and 8%.
Converted to the insurance cost for a single Very Large Crude Carrier (VLCC) crossing, the cost has jumped from about $250,000 pre-war to between $800,000 and $8 million currently. The job of insurance companies is to price risks, and the real implication of this layer is that if insurance companies refuse to underwrite, shipowners will not bear the uninsured transit risk; the "physical opening" of the Strait and "actual navigation" are two distinct matters.
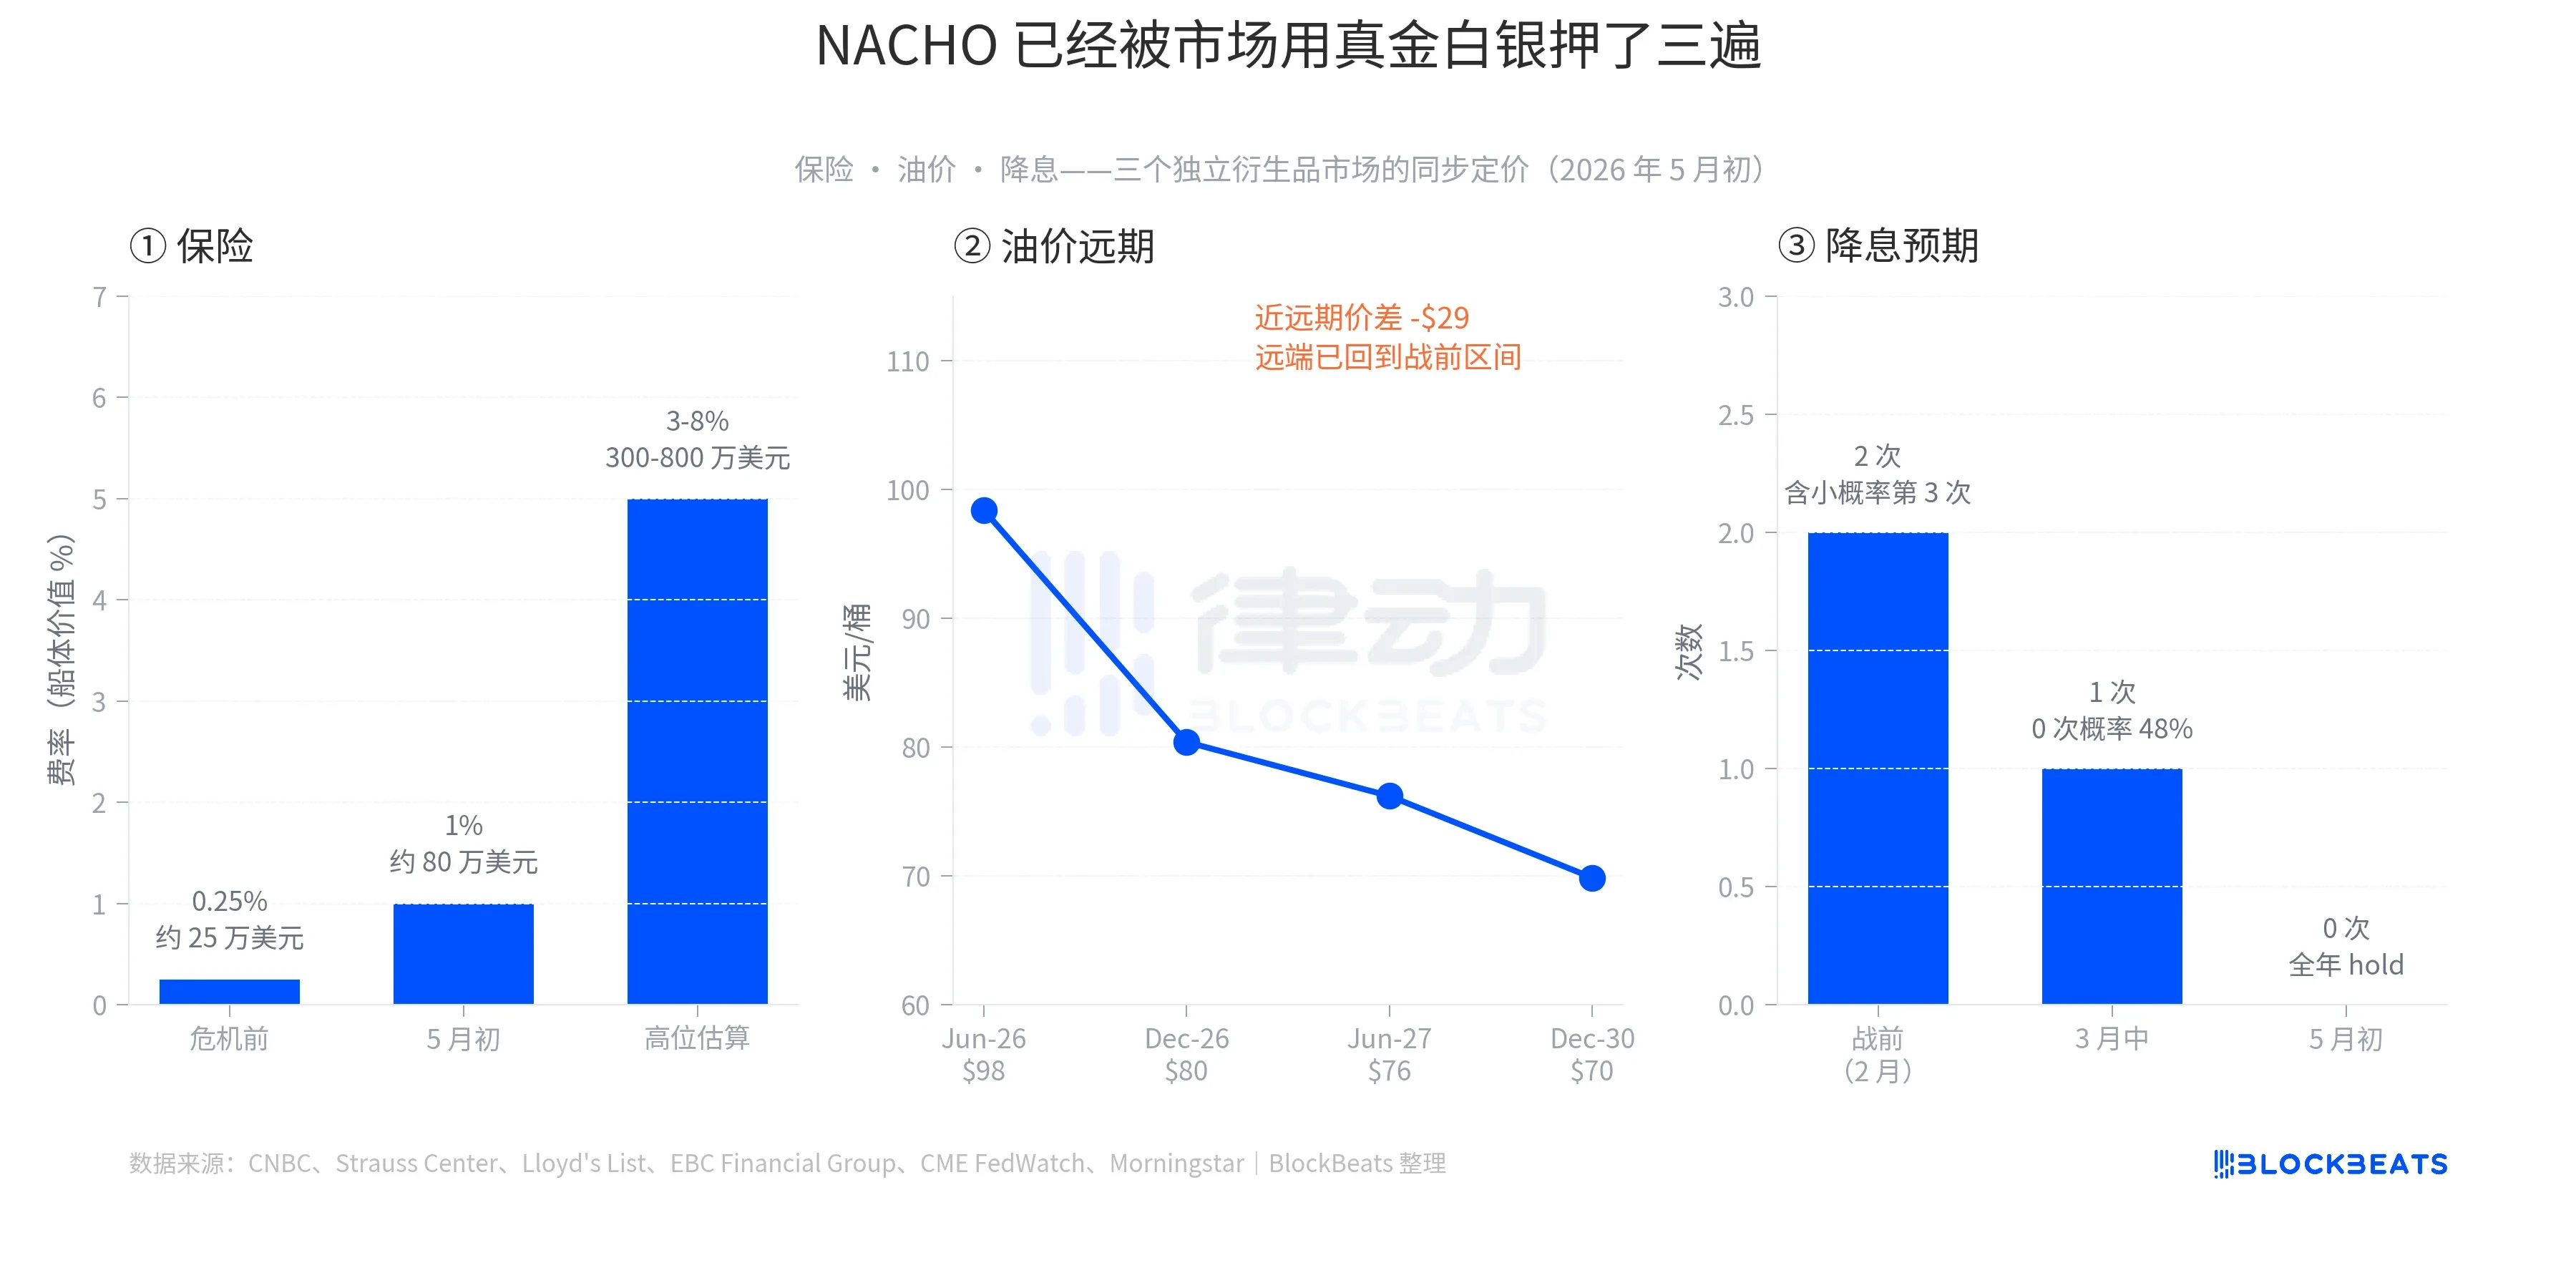
The second layer is oil prices. Early May data showed that Brent's Jun-26 contract was at $98.41, Dec-26 at $80.39, Jun-27 at $76.20, and Dec-30 at $69.85. The spread between the near month and Dec-30 is approximately $28.5, one of the steepest backwardation structures in the past 5 years (near high distant low). This curve tells a very specific story: the market believes that while spot prices are tight, they will eventually ease, with long-term prices returning to pre-war levels of $60 to $70. In other words, high oil prices are not the endgame, but rather a bounded window. However, this window is long enough for traders not to bet on its sudden end.
The third layer is interest rates. In early February 2026, the market expected the Fed to cut rates 2 times that year, with a low probability of a 3rd time. After oil prices spiked in March, the expectation was reduced to 1 time, with the probability of 0 rate cuts rising to 48%. On April 29, the Fed maintained the rate between 3.50% and 3.75%. On May 6, the CME FedWatch showed a 70% probability of holding in the June meeting, and the market for the whole year of 2026 was already priced at 0 rate cuts. Legendary hedge fund manager Paul Tudor Jones even said in a May 7 interview with CNBC, "Waller also has no chance to get the Fed to cut rates."
All three layers have left their mark in the derivatives market; this is not just narrative, it is real money.
A Fragmented Market
The second not easily observable detail of NACHO is that it has led to differentiated pricing within the broader market.
As of the close on May 7, the energy sector ETF (XLE, State Street's Energy Select Sector Fund) has risen 31.63% year to date, making it the only major sector expected to rise throughout 2026. The S&P 500, in the same period, has risen about 24%. The transportation sector ETF (IYT, iShares US Transportation ETF) has risen only 8.79% year to date, lagging the market by more than 15 percentage points.
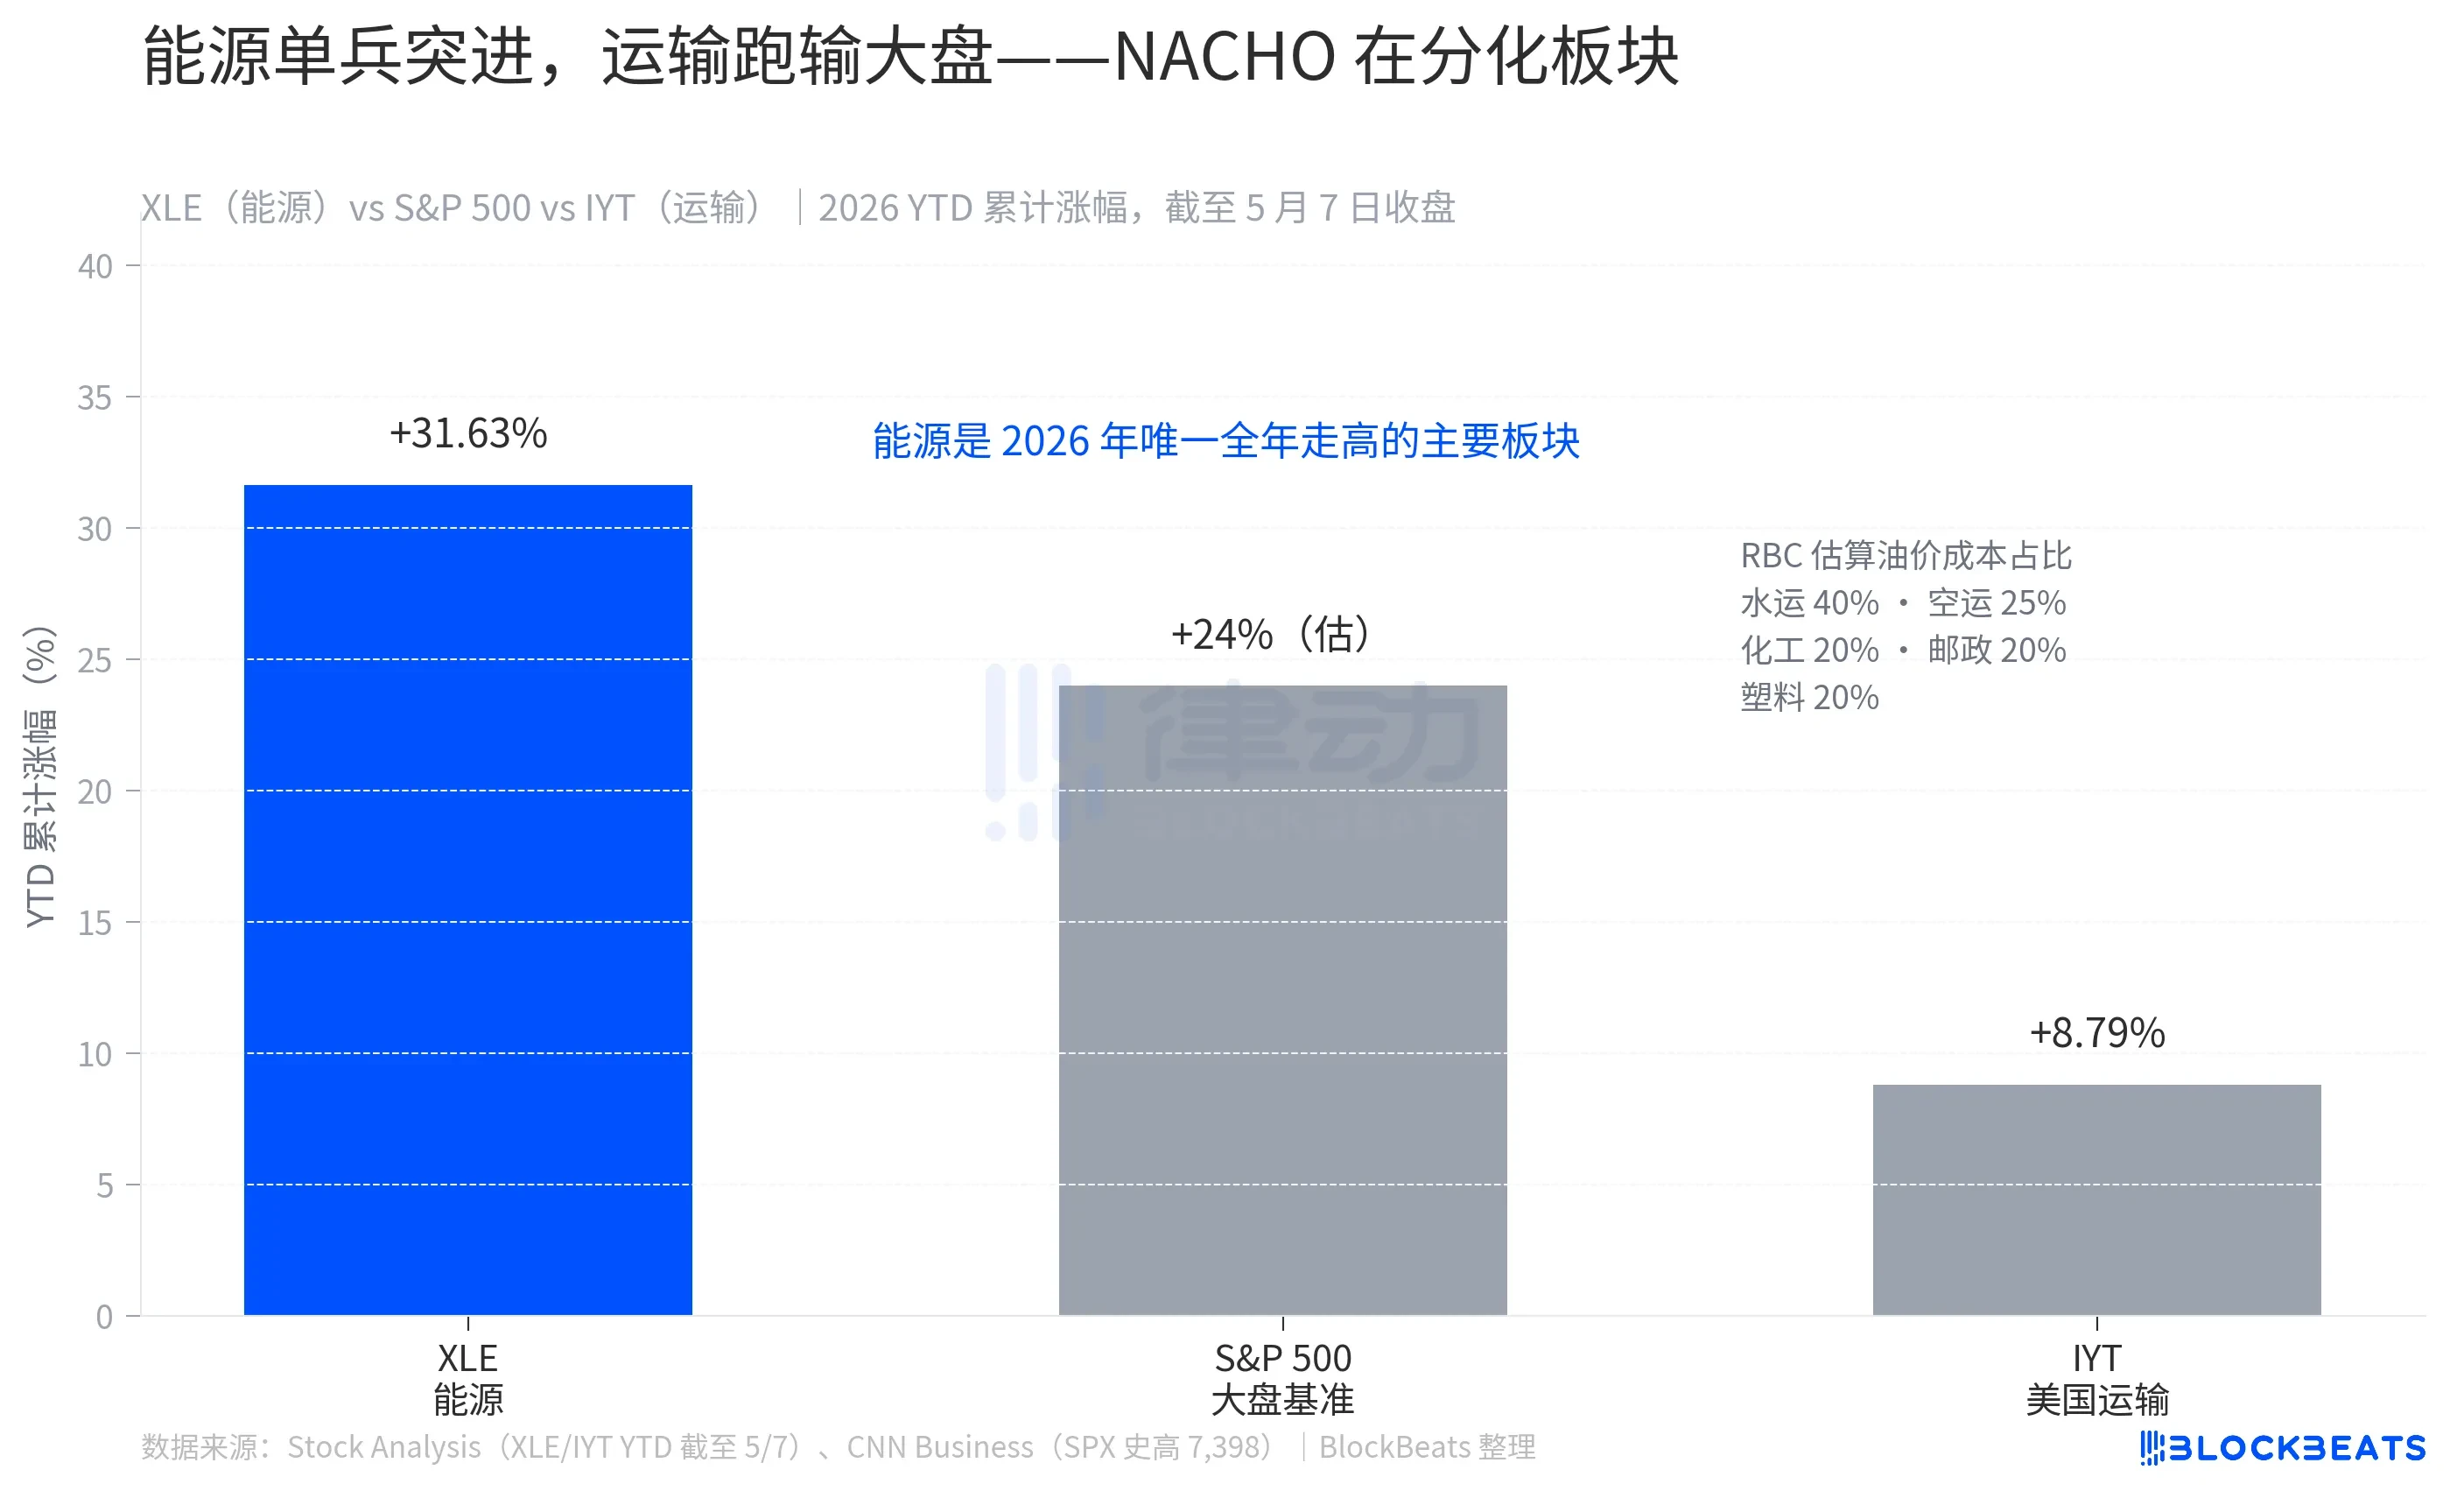
This gap is not random. According to estimates by the Royal Bank of Canada Capital Markets, the operating costs in the shipping industry account for 40% of fuel costs, 25% for air transport, and 20% each for chemicals, postal delivery, and rubber plastics. If oil is a significant part of your business costs, NACHO hits you directly in the face.
The 31.63% growth of XLE is not a short-term rebound, but a result of 8 weeks of sustained outperformance. The 8.79% of IYT is not weakness, but rather a situation where it rises with the broad market while losing yield to rising oil prices. The market has clearly told readers how to calculate the odds of NACHO; just a glance at the extent to which the transportation ETF has underperformed the market is sufficient.
But NACHO is not a bet for an indefinite period; it has a very specific deadline, June 1.
According to estimates from JPMorgan's commodity research team, global commercial crude oil inventories were about 8.4 billion barrels at the beginning of 2026, but only around 800 million barrels of that are "actually usable," while the rest consists of pipeline fill, bottom tank inventories, and minimum terminal reserves that maintain the system's daily operations. Since the onset of this crisis, 280 million barrels have already been utilized, with about 520 million barrels of usable inventory remaining. JPMorgan stated that, "Commercial inventories are expected to approach operational pressure levels by early June."
"Operational pressure levels" is a concrete physical concept. According to JPMorgan's explanation, "The system will not collapse because oil disappears; it will collapse because the circulation network no longer has enough workload." Once this line is breached, the two options available to enterprises and governments are to either squeeze the necessary minimum stocks (which will damage the infrastructure itself) or wait for new supply. If Hormuz remains closed until September, OECD commercial inventories may fall to the so-called "operational floor." According to Fortune, European aviation fuel inventories are expected to fall below the 23-day supply threshold in June, which is a critical warning line for the industry.
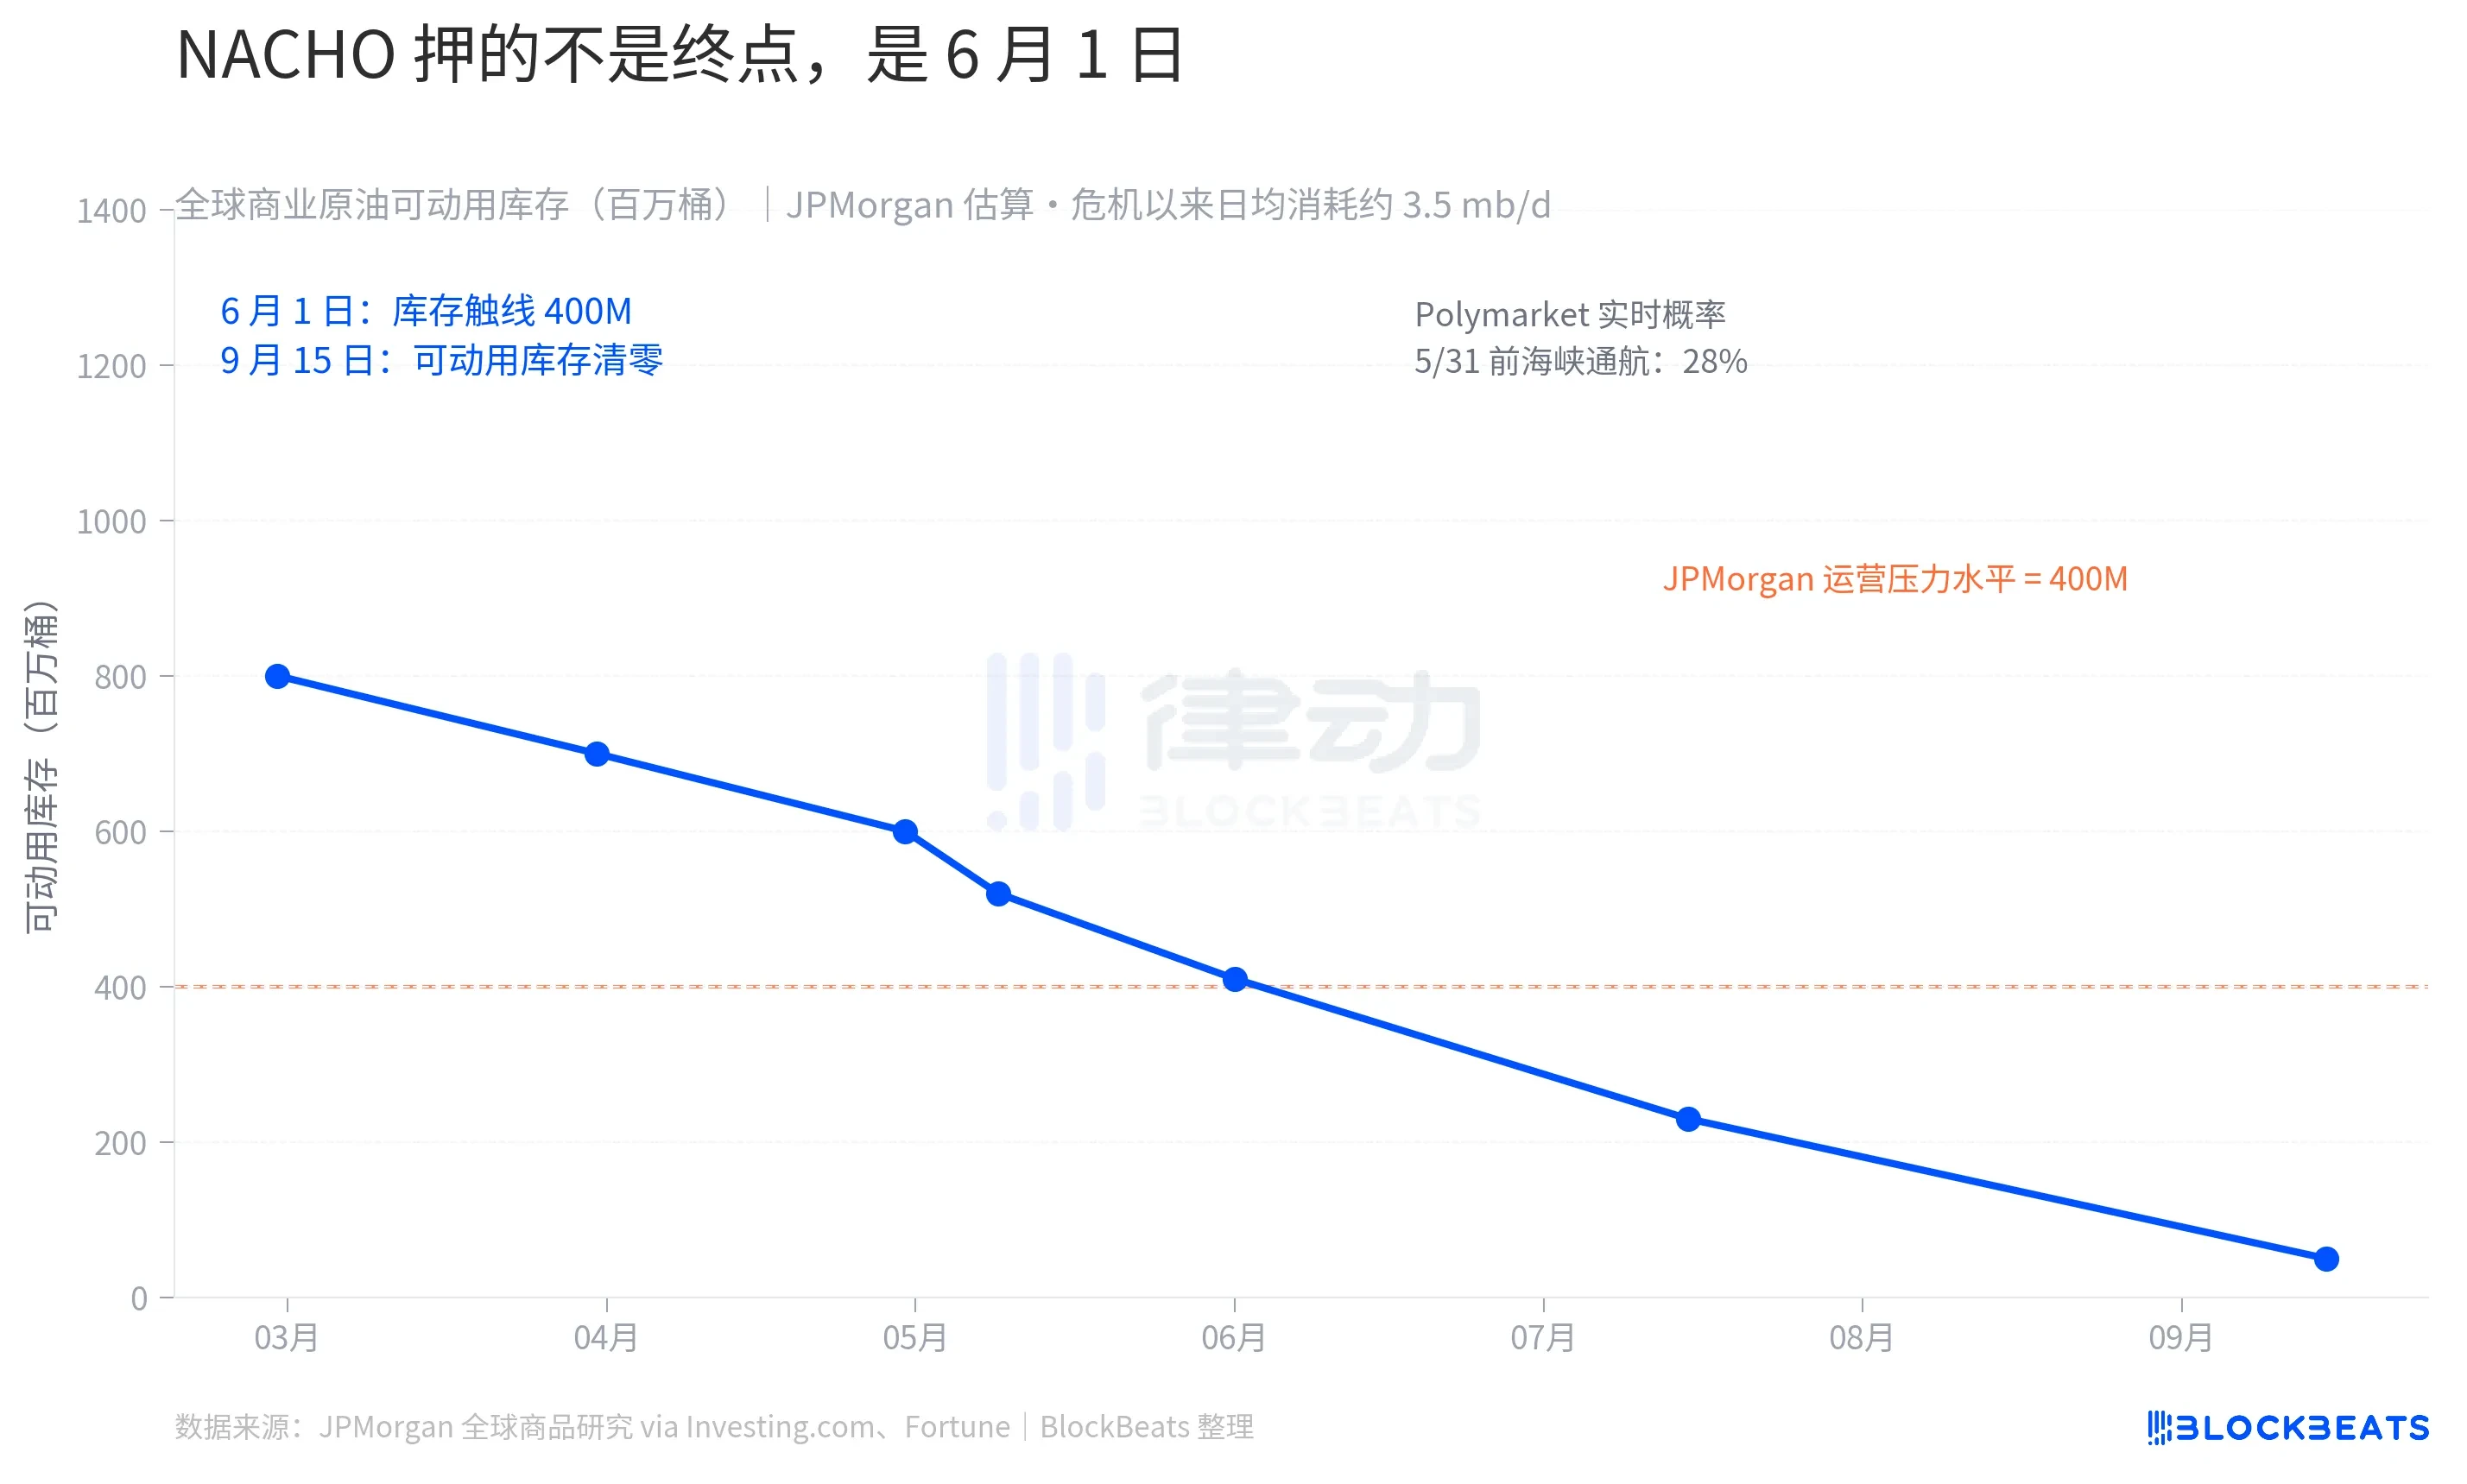
Forecast market odds are synchronized with the physical clock. According to Polymarket data from May 9, the probability of "the Strait of Hormuz being navigable normally before May 31" is 28%, while the probability before May 15 is only 2%. The active positions of $9.92 million in this market are betting that NACHO will not fail at least within May.
The market is no longer trading on Trump's next Truth Social post but is beginning to trade on the June inventory data from the Strait of Hormuz.
免责声明:本文章仅代表作者个人观点,不代表本平台的立场和观点。本文章仅供信息分享,不构成对任何人的任何投资建议。用户与作者之间的任何争议,与本平台无关。如网页中刊载的文章或图片涉及侵权,请提供相关的权利证明和身份证明发送邮件到support@aicoin.com,本平台相关工作人员将会进行核查。