Trading looks at candlesticks, the core is to assess market capital emotion and trend rhythm. Beginners rely solely on a single candlestick to judge rises and falls, easily deceived by short-term fluctuations. However, thecandlestick patterns are the core tool for identifying trend continuation. Today, I will explain in detail the highly usableDescending Three Methods pattern in practice.
The Descending Three Methods is a typical continuation pattern of a downtrend, existing only in a bearish market. Its core signal is very clear: interim rebounds are just short-term corrections, the bearish main forces have not exited the market, the downtrend will continue, and one must avoid blindly bottom-fishing. Most people get trapped in a downtrend considering this mid-rebound as a market reversal.
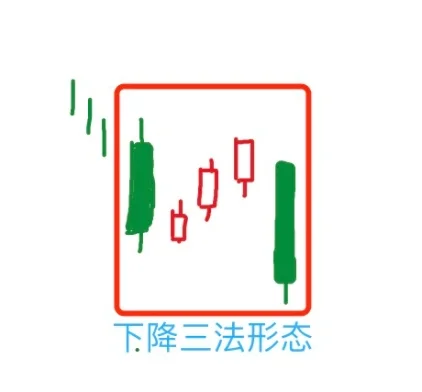
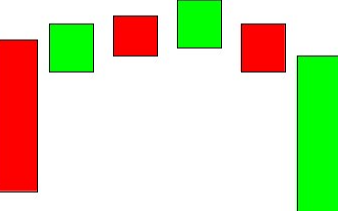
First, let’s discuss the standard pattern structure for quick identification. When the market is in a downtrend, it starts with a large solid bearish candlestick, establishing a bearish dominant pattern. Then, three short bullish candlesticks follow, reflecting a minor rebound but with very weak momentum, failing to break the high of the previous large bearish candlestick. Finally, a large bearish candlestick closes, engulfing most of the rebound gains and refreshing the new low for the period, thus forming a complete Descending Three Methods pattern.
Many beginners mistakenly believe that consecutive bullish candlesticks in a downtrend indicate a bullish recovery, but this is not the case. These three small bullish candlesticks are merely a weak rebound during the downtrend, a result of brief short-seller rest and small bullish bouts without substantial buying strength. Once the short-term bullish momentum is exhausted, the bears will once again exert force to crush prices, initiating a new round of decline with a closing large bearish candlestick.
In practice, there’s no need to rigidly adhere to three bullish candlesticks. The market is flexible and variable, two or four small rebound candlesticks can also form a similar Descending Three Methods pattern. The core judgments have only two points: first, the rebound candlesticks are weakly pressured and do not break the high of the previous large bearish candlestick; second, subsequent bearish candlesticks break down, confirming the continuation of the bearish trend.
Sharing key practical pitfalls: if an interim rebound candlestick has a relatively large body and directly breaks the high of the previous large bearish candlestick, it does not belong to the Descending Three Methods, but rather is a signal of a bearish reversal, and one should not blindly be bearish. Meanwhile, this pattern is only applicable during the early and mid-stages of a downtrend; if this pattern appears after a prolonged decline, it is mostly a false signal for shorts, and one should avoid pursuing bearish positions casually.
Next, let’s discuss the operational trading thought: after the standard Descending Three Methods pattern forms, it presents a quality opportunity to short in line with the trend. When the closing large bearish candlestick breaks down, one can enter short positions for the short term, with stop losses set at the highest point of the rebound, keeping risks controllable and the risk-reward ratio excellent. Friends holding long positions, upon seeing weak consecutive bullish repairs during a decline, need to be cautious of a reversal falling short. Once the market breaks down and falls back, be sure to stop-loss timely to avoid deep loss risks.
Overall, the Descending Three Methods is a clear signal of a continuation in the downtrend, and is by no means a bottom signal. It signifies the end of a brief market correction, and bears regain control of the market. The biggest taboo in trading is bottom-fishing against the trend; mastering this pattern can effectively avoid falling into the continuation trap of declines, adhere to trend-following trading, and greatly enhance operational win rates and stability.
For more valuable content, follow the public account: Big Bull Speaks of Market Trends
Disclaimer: This article is a personal trading review record, only for technical exchange reference, and does not constitute any investment advice. The financial market is highly risky, entering requires caution, and all trading profits and losses are borne by oneself.
免责声明:本文章仅代表作者个人观点,不代表本平台的立场和观点。本文章仅供信息分享,不构成对任何人的任何投资建议。用户与作者之间的任何争议,与本平台无关。如网页中刊载的文章或图片涉及侵权,请提供相关的权利证明和身份证明发送邮件到support@aicoin.com,本平台相关工作人员将会进行核查。