Cryptocurrency Scholar: Is the Breakdown of the 6.3 Bitcoin Daily Line Structure Hiding a New Round of Deep Downward Turning Point? Latest Market Analysis and Operation Suggestions
Bitcoin is currently priced at 67450, and yet another round of sharp decline is washing over the market. Many people added positions at high levels earlier and, as the price fell, blindly averaged down, leading to deeper entrapment. In fact, when trading in the cryptocurrency market, the biggest fear is being driven by emotions from price fluctuations. Panic selling during declines and blindly bottom-fishing during deep drops are common issues. Currently, the downward trend remains unchanged; there is no need to rush to catch a bottom for a reversal. It’s better to patiently wait for the indicators to stabilize and the patterns to materialize before positioning, or, like me, continuously go south while strictly implementing stop-losses to achieve consistent positive growth.
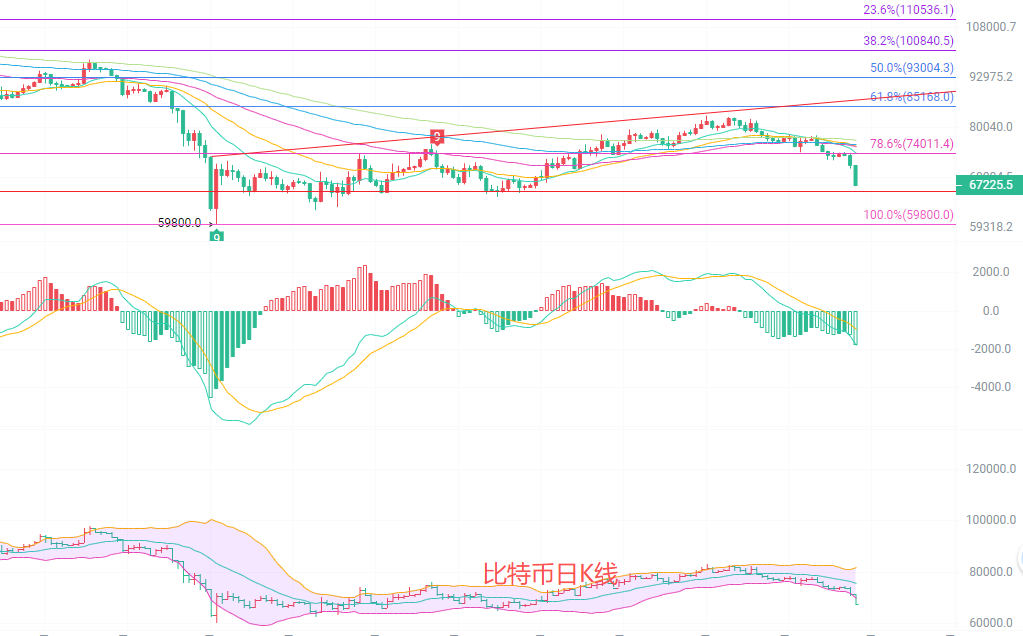
The daily candlestick chart shows a drop of 5.52%, with the price directly breaking below all EMA short-term moving averages for the 15/30/60 day period. The moving averages have fully transitioned from support to resistance. The Bollinger Bands are opening downward, and the current price has pierced the lower Bollinger Band at 69920, indicating concentrated downward pressure. The MACD indicator's DIF has significantly crossed below the DEA, and the green bars continue to expand, indicating that the downward momentum has not yet exhausted. The previous daily line structure around 72000 has completely broken, and the key pressure level has shifted down to around 71790. The daily level has clearly transitioned to a downward trend; a short-term rebound is likely to be a technical correction and is difficult to reverse the larger downward direction.
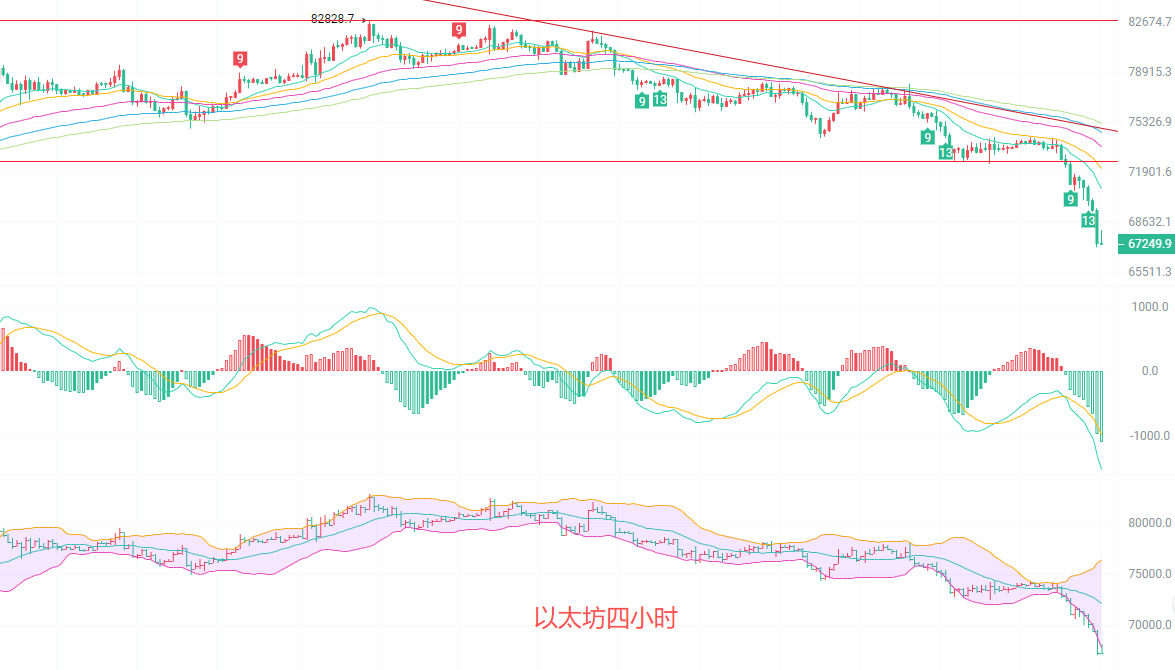
The four-hour candlestick chart shows that the EMA moving averages for the entire period are aligned downward, and the price continues to operate below the moving averages, which layer upon layer suppress the rebound space. The Bollinger Bands remain open downward, with the price closely adhering to the lower Bollinger Band at 67902. The divergence of the Bands indicates that the short-term downward movement is still gaining strength. The MACD double line continues to move down, with green bars constantly refreshing and expanding, showing no bullish divergence signal to indicate a stop to the decline. The market has been in a stepped decline since the high point of 82828, with rebound peaks gradually moving lower. After a short-term slight consolidation, it is very likely that the inertia downward will continue, with short-term support to reference around 67035. If it breaks the support, it will open up a new round of downward space.
Short-term strategy reference: Follow the trends of the larger cycle, with small stop losses and quick entry and exit.
For the lower range of 71300 to 70800, go north, stop loss at 70300, target at 67000 to 66000.
For the upper range of 66000 to 66500, go south, stop loss at 65500, target at 68000 to 69000.
Specific operations should primarily rely on real-time market data. For more detailed information, you can consult the author. There may be delays in publishing the article; suggestions are for reference only and risks are to be borne by the reader.


Gentle Reminder: The above content is solely created by the author for the public account and Weibo. All advertisements at the end of the article and in the comments section are unrelated to the author. Please exercise caution in distinguishing this, thank you for reading.
免责声明:本文章仅代表作者个人观点,不代表本平台的立场和观点。本文章仅供信息分享,不构成对任何人的任何投资建议。用户与作者之间的任何争议,与本平台无关。如网页中刊载的文章或图片涉及侵权,请提供相关的权利证明和身份证明发送邮件到support@aicoin.com,本平台相关工作人员将会进行核查。


