
Author: Bull Theory
Translated by: Yuliya, PANews
Is the 4-year cycle of Bitcoin still valid? This was the most predictable crash in cryptocurrency history, yet no one was prepared.
At the peak of the 2025 bull market, the most common narrative in the crypto space was that the 4-year cycle was dead, institutional entry had changed everything, and the old rules no longer applied. However, Bitcoin almost perfectly reached its expected peak, then fell by 50%, and is now at the predicted location according to the cycle framework. So, let's have an honest conversation about what actually happened.
The 4-year cycle is not dead, only the buyers have changed
Throughout 2024 and early 2025, the crypto market was filled with a narrative that Bitcoin ETFs changed everything, institutions were buying, and the traditional 4-year cycle driven by halving and retail FOMO was no longer applicable. This is a super cycle where bear markets won’t come back.
This reasoning sounded very convincing. Bitcoin set a record high before the halving, which was unprecedented. ETF inflows hit record levels. Michael Saylor was buying billions of dollars worth of Bitcoin every week. For the first time, mainstream financial media reported on Bitcoin as a compliant asset class. The atmosphere of the entire market made it feel like the old rules were no longer in effect.
However, Bitcoin peaked at $126,296 on October 6, 2025, and subsequently started to fall. Its price has now dropped about 50% from its peak, the Fear and Greed Index is in extreme fear, and a death cross has appeared on the charts. The cycle that was thought to be dead is now playing out accurately, like in 2013, 2017, and 2021.
The 4-year cycle has not died; it has just become more concealed. The reason it has become concealed is why no one foresaw the peak and why no peak indicators issued warnings. This is the most important point for us to understand our current position and future direction.
But before delving into this, it is necessary to understand what cycles are and why they have persisted for over a decade. Because those who deny the cycles are not entirely wrong. The market has indeed changed, but the cycles have not been broken; they have evolved along with the market.
Every four years, a halving event cuts the number of newly produced Bitcoins by half. Miners are the largest and most consistent sellers of Bitcoin, digging up Bitcoin and selling it to cover operating costs. When the halving reduces their output by half, the number of Bitcoins sold to the market each day drops significantly. If demand remains constant or increases, prices will ultimately rise. This is the fundamental mechanism behind Bitcoin price fluctuations; it is not theoretical but based on supply and demand.
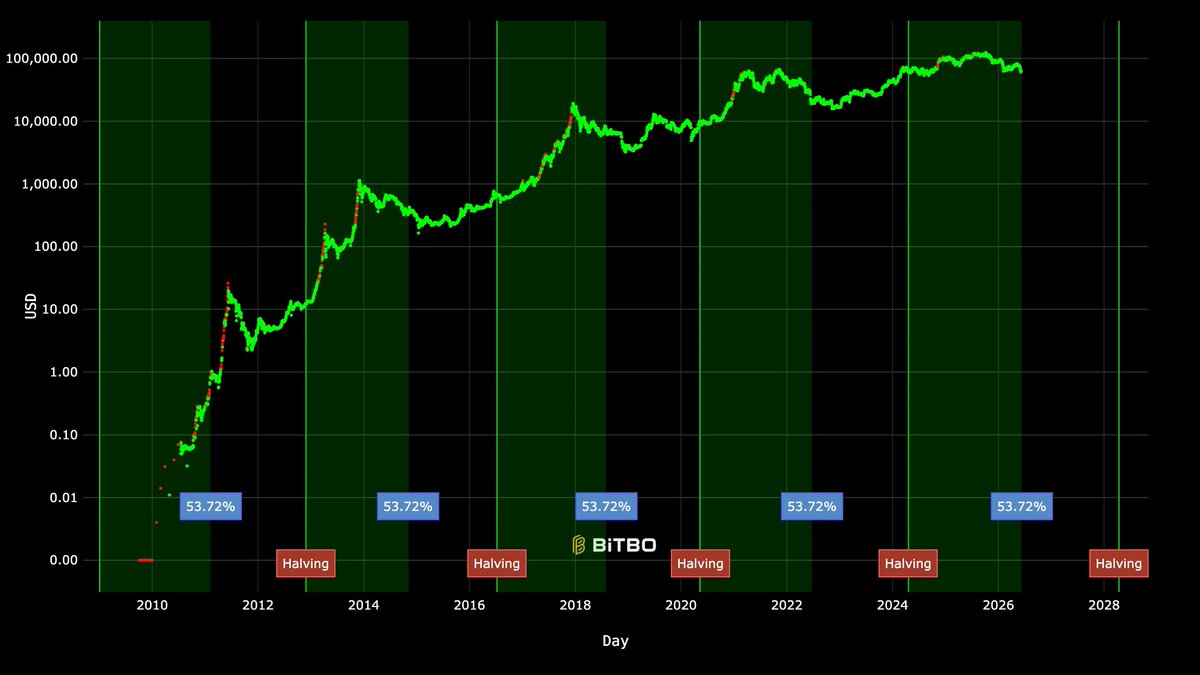
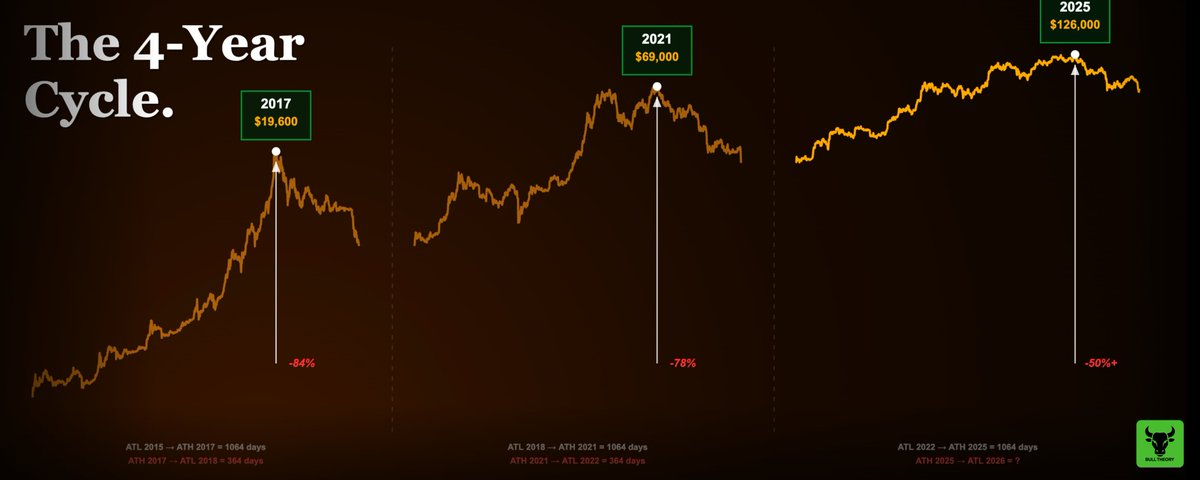
Looking back at the halvings since 2012, the transitions between Bitcoin's bull and bear markets have invariably repeated.
Four cycles, four halvings. Each one's basic structure is remarkably similar. And that is precisely what those who proclaim the cycle is dead overlook: the cycle does not care about narratives. It operates on the supply-demand mechanism, which does not change simply because institutions start buying through ETFs. The halving in April 2024 will arrive as scheduled. Bitcoin peaked on October 6, 2025, 535 days later. This falls perfectly within the historical window where previous cycles peaked 480 to 550 days after the halving.
The cycle has never disappeared. It only appears different on the surface because the buyers have changed. And this difference: Institutional demand has replaced retail demand, which is why no peak indicators were triggered, and why most who focused on peak signals completely missed the top.
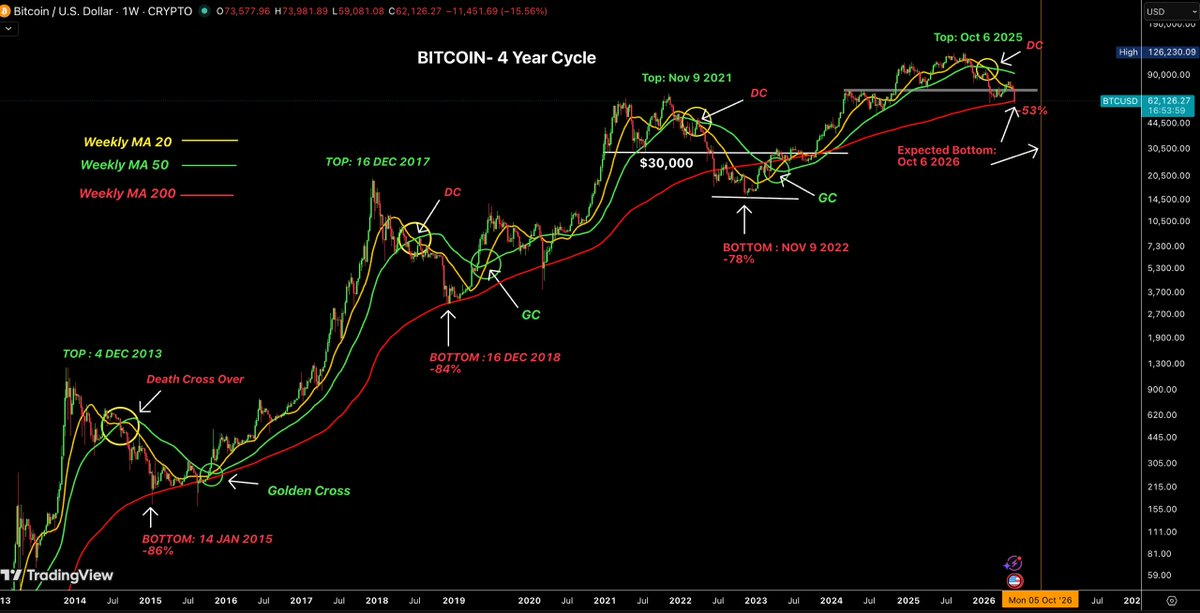
Tracking these four Bitcoin cycles, noting the tops, bottoms, death crosses, golden crosses, and the 200-week moving average
There is another stable pattern in these cycles that has not received enough attention: The bottom always occurs about a year after the top. While not exactly a year, this range is remarkably tight. After peaking in 2013, the bottom came 410 days later. After 2017, it was 363 days. After 2021, it was 376 days. If this rhythm holds, the current cycle's bottom will fall between the end of September and mid-November 2026.
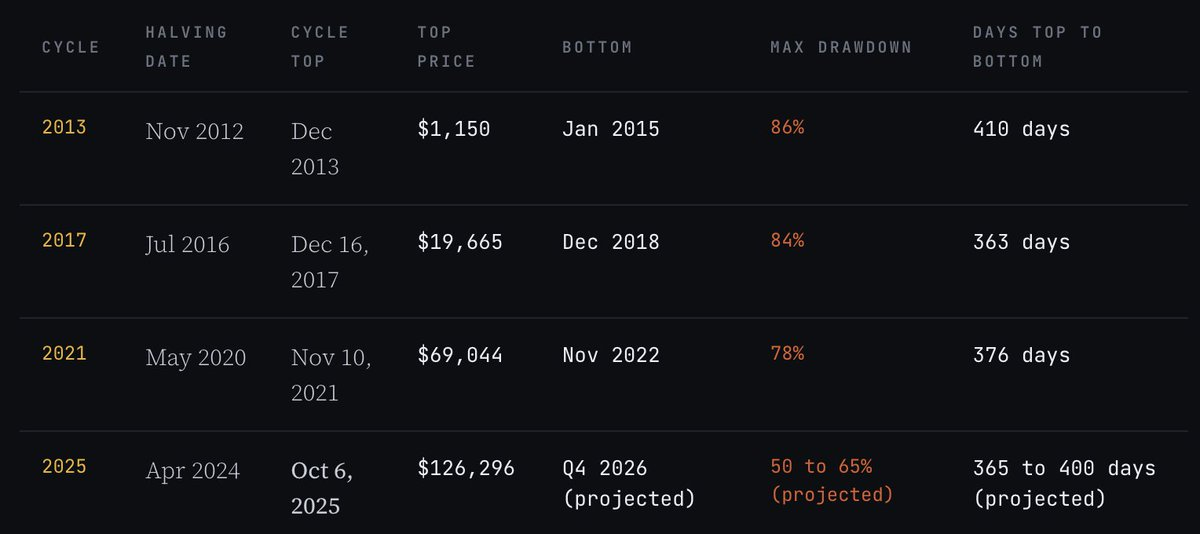
There is also a clear trend in the drop percentages: 86%, 84%, 78%, and now possibly 50% to 65%. Each bear market has been shallower than the last. This is not accidental. It reflects a maturing asset: now it has institutional buyers who won't panic sell, a regulated ETF market creating structural demand, and companies holding Bitcoin as a reserve on their balance sheets. As the buyer demographic matures, volatility is being compressed.
One unprecedented event in this cycle is that Bitcoin hit an all-time high before the halving. In March 2024, exactly one month before the April 20 halving, Bitcoin reached $73,581, breaking the previous record of $69,000 set in 2021. This was a new historical high but not the cycle top. Each past cycle has seen peaks several months after the halving, and this time is no exception— the real cycle top appeared at $126,296 on October 6, 2025, long after the April 2024 halving. The difference is that hitting an all-time high before the halving has never occurred before. This was due to the approval of the spot Bitcoin ETF in January 2024, which brought institutional demand into the market before the halving, effectively bringing the cycle forward in time and leaving many who track the usual timing after halving confused.
What happened to retail in this cycle?
To understand why Bitcoin peaked without any common signals, you must examine what happened to retail funds in the 18 months leading up to the peak. In short: Most retail funds were exhausted before Bitcoin reached $126,000.
In previous Bitcoin bull markets, retail played a specific role. They provided the final fuel, creating the last frenzy and parabolic surges. It was the FOMO sentiment of retail that pushed Bitcoin from reasonable prices to extreme prices in the final stages of each cycle. This is also why peak indicators are triggered—those tools were initially designed to measure retail behavior, not institutional behavior. Without retail frenzy, there are no triggers for indicators.
In this cycle, retail never appeared in a substantial form in Bitcoin. This is not because they did not participate in the crypto market; they did engage, but they were first "cleaned out" elsewhere.
The liquidity trap of Memecoins
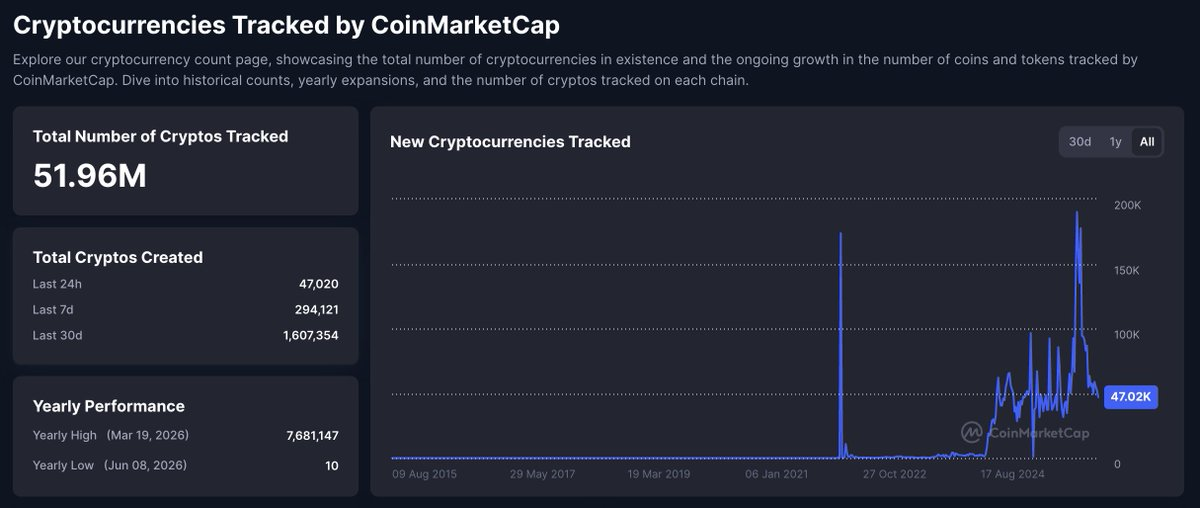
The biggest factor destroying retail liquidity this cycle is that creating and issuing Memecoins has become extremely easy. Token issuance platforms (especially on Solana) allow anyone to launch a token in minutes at almost zero cost. By mid-2025, the total number of tokens skyrocketed from around 10,000 to 20,000 at the peak in 2021 to over 10 million.
Think about what this means for a retail investor trying to navigate the market. In 2021, there were probably 200 tokens worth considering seriously—genuine projects with users, revenue, or at least a reliable team and product roadmap. The path from "I want to invest in crypto" to "I bought ETH and SOL" was very short and clear. That was where retail funds concentrated and why ETH rose to $4,800 and SOL to $260.
But in 2025, you have to choose among 10 million options. The vast majority of these tokens are designed for one purpose: to extract funds from retail buyers as quickly as possible and transfer them to insiders. The operation is not complicated: create a token, artificially generate hype, sell when retail buys, and then cash out. This practice repeats thousands of times across the ecosystem daily.
In 2021, the number of options faced by retail investors was manageable, and most were legitimate projects. By 2025, retail investors were confronted with millions of options, most of which structured to harvest their funds. The result is predictable: retail funds entered the crypto market in 2025, but most never flowed into Bitcoin or quality altcoins; instead, they were first drained by Memecoin interests.
The involvement of influential public figures further amplified the problem. Numerous high-profile individuals from politics, entertainment, and social media launched their own Memecoins this cycle. The pattern was always the same: a token bearing a celebrity's name is launched amidst huge hype, retail expects to profit from the name effect, the price rises, and insiders and early holders sell at the peak. The token then plummets 80% to 95% within days or weeks. Retailers are left with worthless tokens, worth only a fraction of what they paid.
This situation occurred over and over again throughout 2024 and 2025. Each time, a significant portion of retail liquidity was permanently erased from the ecosystem. Those who lost money in these projects did not turn around to buy Bitcoin with the remaining funds; they either completely left the market or had no funds left to invest.
High FDV of VC Tokens and Low Circulation
The second major factor destroying retail capital is the issuance structure of new tokens in this cycle. This is less discussed but equally devastating.
In 2021, new crypto projects typically launched with a fully diluted valuation (FDV) of $100 million to $1 billion. This left real room for price appreciation for public market buyers. A project launching with $200 million FDV and growing to $2 billion could provide retail investors with 10x returns. This is what people remember from 2021—those stories of “I early bought this token and turned $5,000 into $50,000.”
In this cycle, the structure has changed drastically. Venture capital funds raised tens of billions of dollars to invest in crypto infrastructure in 2021 and 2022. By 2024 and 2025, their portfolio companies were ready to issue tokens, and VCs needed to show returns to their limited partners (LPs). Therefore, projects began to launch with fully diluted valuations of $5 billion, $10 billion, or even $20 billion, while the actual circulating supply on the first day was only 5% to 15%.
What this means in practice: Retail sees a token trading at a seemingly $500 million market cap and thinks there is room for appreciation. But the real fully diluted valuation at that price is $10 billion, with 85% of the tokens sitting in VCs’ wallets, waiting to be unlocked in the next two to four years. More tokens are unlocked and sold every month. Prices face a structural ceiling because the supply pressure never stops. Retail buyers are essentially buying into a continuous sell-off they are unaware of.
A study tracking 118 tokens issued in 2025 found that 84.7% traded below their issuance valuation, with a median price drop of 71%. These are not obscure projects; many are listed on major exchanges with large marketing budgets and media exposure. Yet they still lost most of their value because their tokenomics were designed to benefit insiders at the expense of public buyers.
The consequences of the simultaneous issuance of Memecoins and high FDV VC projects is that retail crypto funds were massively destroyed before Bitcoin even approached its cycle top. By October 2025, most retail participants who entered the market in 2024 were either severely in the red or had completely exited. There was no remaining liquidity to rotate into Bitcoin. There was no wave of FOMO. The fuel that drives the final frenzied top was no longer present.
Where should retail money have gone?
The reason the 2021 cycle worked was that retail funds had a clear path: Buy Bitcoin → Bitcoin rises sharply → Rotate into major altcoins → Major altcoins rise → Rotate into mid-cap altcoins → Mid-cap altcoins rise → Rotate into small-cap coins. Funds poured down a predictable market cap chain, generating returns at each layer.
But in 2025, this waterfall effect never commenced. Retail never made large-scale buys of Bitcoin; their capital had been exhausted. Throughout almost the entire bull market, Bitcoin's market cap share remained above 60%. The altcoin season index briefly peaked at 78% for about three weeks in September 2025, only to crash immediately afterward. There was only a brief window when altcoins outperformed Bitcoin, after which Bitcoin’s share quickly returned to above 60%.
The anticipated altcoin season did not arrive because the market did not misjudge; the mechanism that generates altcoin seasons—retail funds rotating down the market cap chain—had failed. The funds had long been drained.
How did institutions change the structure of the entire cycle?
While retail was losing money in Memecoins and VC token issuance, something entirely new was happening with Bitcoin. This is the first time that regulated institutional products have poured billions of dollars into Bitcoin on a structured, continuous schedule.
The approval of the spot Bitcoin ETF in January 2024 was more than just a headline. It fundamentally changed the marginal buyer group of Bitcoin, and this change produced a series of chain reactions that made everything in this cycle different from the past.
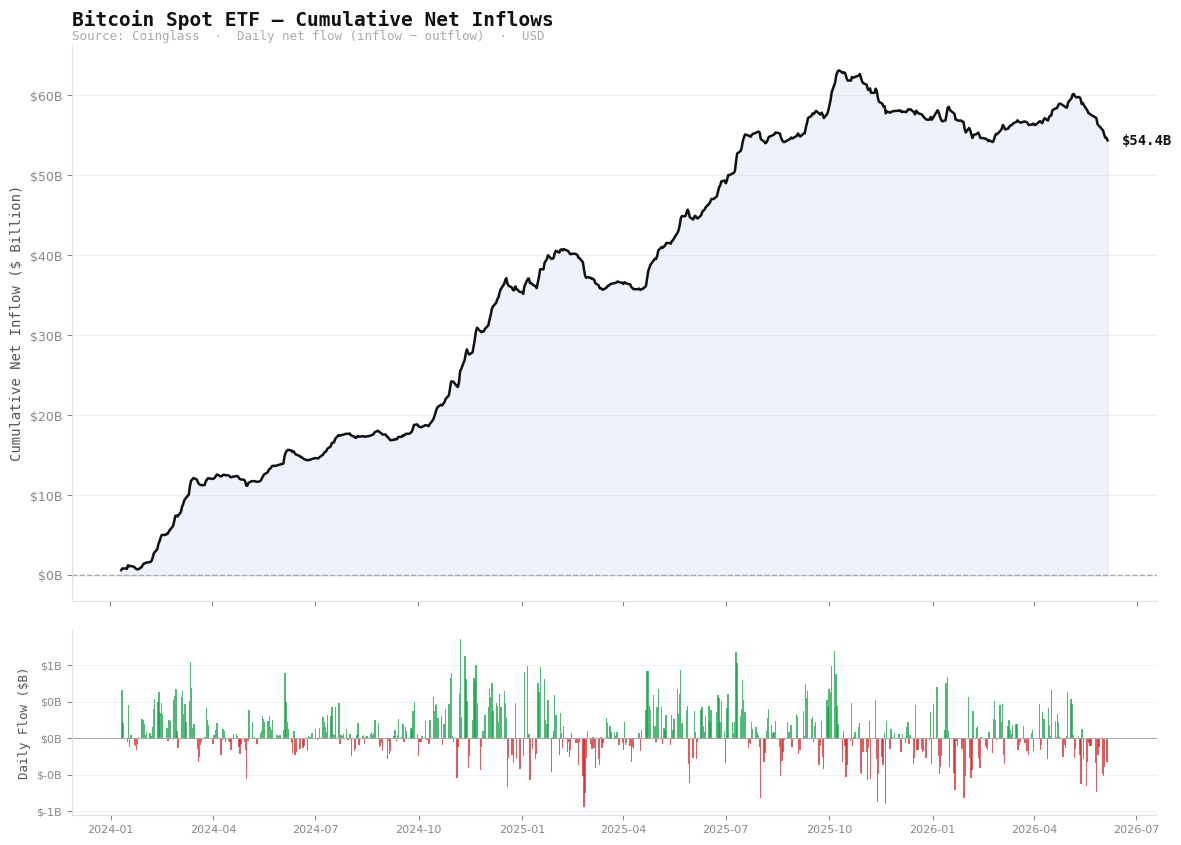
The cumulative net inflows of the Bitcoin spot ETF peaked at $63.1 billion in October 2025 and currently stand at $54.4 billion (data source: Coinglass).
From January 2024 to October 2025, the spot Bitcoin ETF gathered a cumulative net inflow of $63 billion. At the peak, the daily inflow exceeded $350 million, which is 8 to 9 times the value of newly mined Bitcoin each day. On the largest single day of inflows, over $1 billion poured in within one trading day.
These are not retail investors. They are pension funds, registered investment advisors, family offices, endowments, and hedge funds making asset allocation decisions on a quarterly basis. They do not check Bitcoin's price at midnight. They do not experience FOMO from a green candlestick on X (Twitter). They accept an asset allocation task and systematically execute it over weeks to months.
When this type of buyer becomes the dominant force in the market, the price movement looks completely different from a retail-dominated market. You no longer see explosive vertical climbs after prolonged consolidation; instead, you see a slow, steady ascent. No longer are there parabolic weekly candles; instead, there is a seemingly unexciting steady upward trend that, over time, yields significant gains.
Bitcoin rose from $40,000 in January 2024 to $126,000 in October 2025, achieving a 215% increase. If this occurred in any previous cycle, such a rise would inevitably include weekly increases of 30% or 40% within a few weeks. But in the current cycle, weekly increases, by historical standards, seem quite modest. While the total increase is indeed substantial, its arrival feels methodical, even somewhat mundane, rather than explosive.
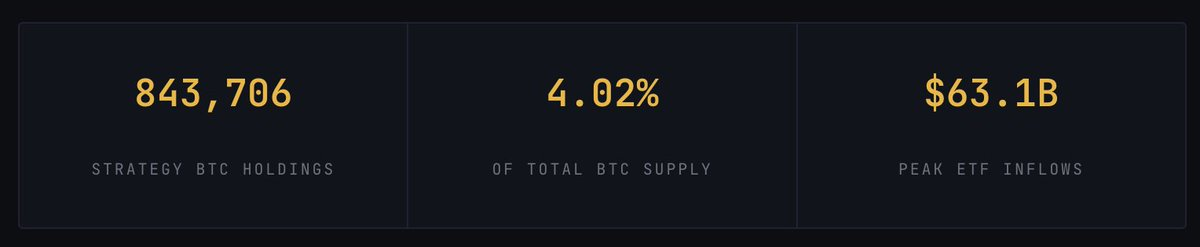
Strategy company holds 845,256 BTC, accounting for 4.02% of Bitcoin’s total supply, all accrued through continuous corporate buying.
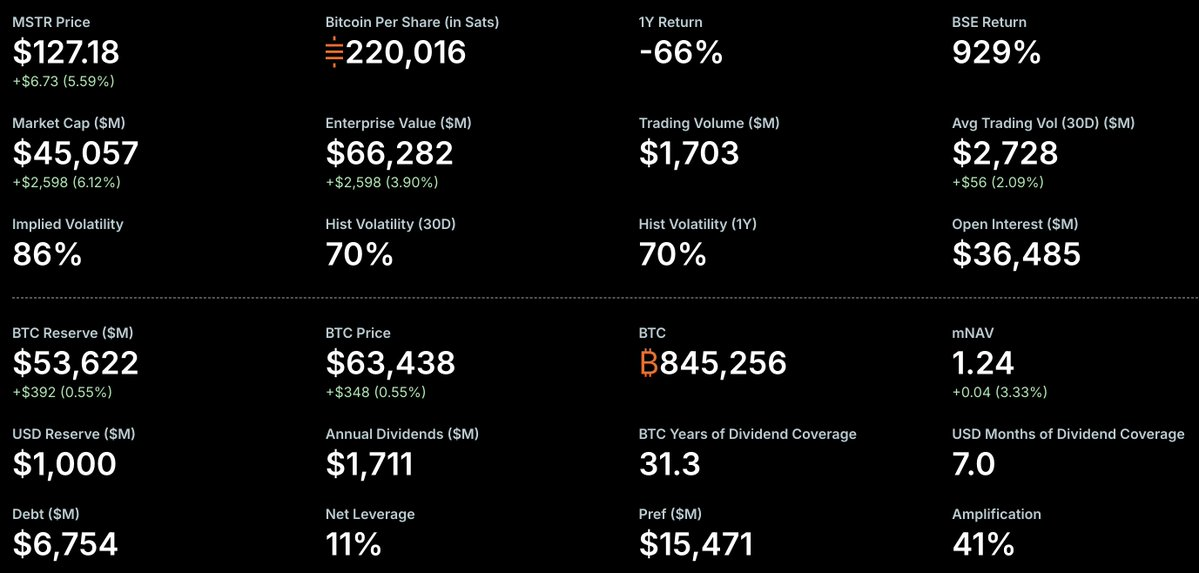
Then we must mention Strategy company. Their model defines the most extreme version of institutional buying in this cycle. They turned the entire corporate fund management strategy into a Bitcoin accumulation machine by raising capital through stock and preferred stock products, then directly investing to buy Bitcoin. As of June 2026, they hold 843,706 Bitcoins, amounting to 4.02% of the total future supply.
In just 2025 alone, they raised $25.3 billion from the capital markets to buy Bitcoin. They neither sell nor hedge. Regardless of the price, they continually accumulate every week. This is a structural buying that did not exist in past cycles.
A key understanding of this institutional structure is how it affects on-chain data. When BlackRock buys Bitcoin for its IBIT, those tokens are transferred to Coinbase Prime for custody, making them nearly invisible in on-chain analysis, no longer traceable like retail activity. ETF purchases do not show as token transfer on-chain as retail trades do. Bitcoin accumulated through the issuance of stocks by Strategy company is reflected in SEC filings, not on-chain. Compared to any previous cycle, the activity triggered on the blockchain by every dollar of demand has decreased.
This is the core technical reason each peak indicator has failed. These indicators measure on-chain activity, token transfers, and realized profit behavior—these metrics' effectiveness hinges on retail being the dominant buyer. When the dominant buyers operate through off-chain custodial institutions and registered financial products, even if hundreds of billions of dollars flow into the asset, these indicators will behave abnormally calm. The math calculations of the indicators are not incorrect; the flaw is that they are measuring the wrong object.
Why did all eight peak indicators fail one by one?
These indicators once had an almost perfect track record. In 2013, 2017, and 2021, they all successfully signaled peaks within days or weeks of actual tops. Analysts were obsessively watching them throughout 2025, waiting for signal emergence. Bitcoin broke through $126,000 and then began to decline. Yet all these indicators remained calmly in neutral or accumulation territory.
This is not because the indicators failed. It is because the market structure they were designed to measure no longer exists. Understanding why each indicator failed will help you understand the current market structure more deeply than any price chart.
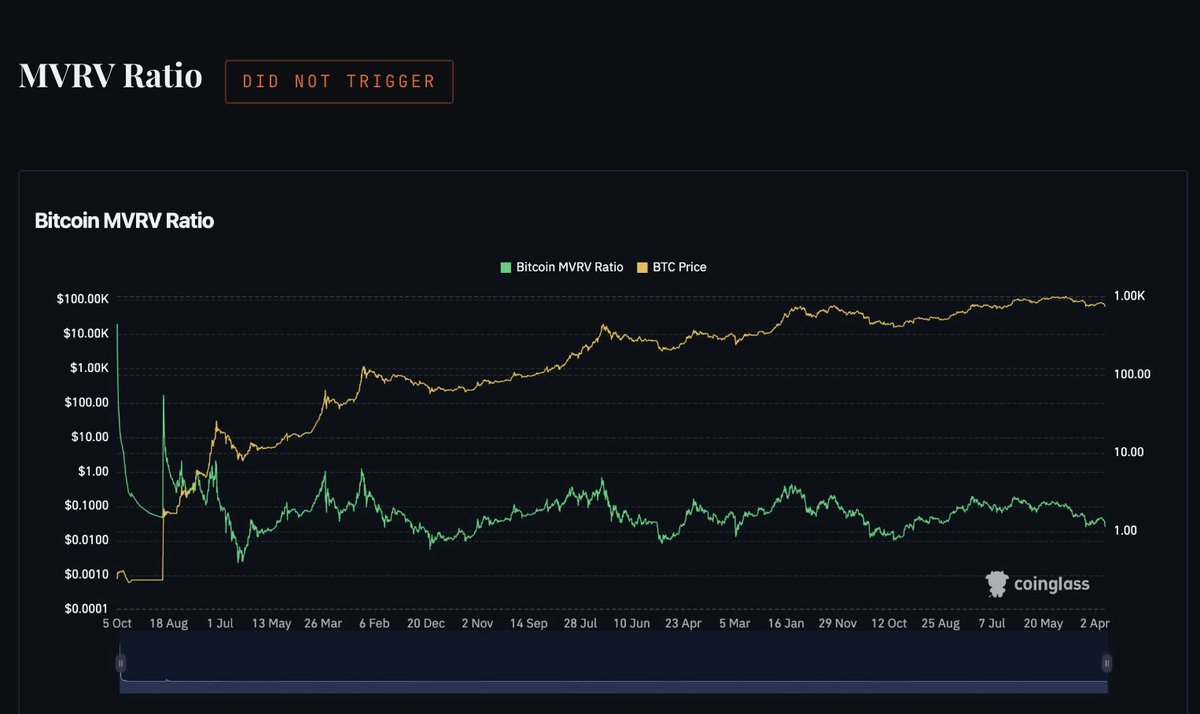
Bitcoin's MVRV ratio: peaked around 3.8 at the 2025 top, whereas previous cycle peaks were between 7 and 10 (data source: Coinglass)
The MVRV ratio is calculated by dividing Bitcoin's market capitalization by its realized market value (i.e., the total price of all tokens when their last movement on-chain occurred). When this ratio is very high, it indicates that ordinary holders are sitting on immense unrealized profits, historically aligning with speculative peaks. During the 2013 top, this ratio exceeded 10; in 2017 it was close to 8; in 2021 it reached 7. A recognized danger threshold is above 7.
However, at the peak in October 2025, the MVRV only reached around 3.8 to 4.2. At the record high, this metric was not even half of the historical warning line. The reason lies in the market structure: ETF buyers and the accumulation by Strategy company reflect demand in Bitcoin's price but do not move tokens in the manner required by MVRV's calculation. Billions of dollars’ worth of Bitcoin is lying in custody wallets at Coinbase Prime for institutional clients and has never “moved” on-chain since being purchased. The realized market value has been artificially depressed because the largest buyers of this cycle operate through a largely invisible custodial institution for on-chain measurements. Thus, when prices are at their highest, MVRV shows the market as if it were still in a mid-cycle stage.
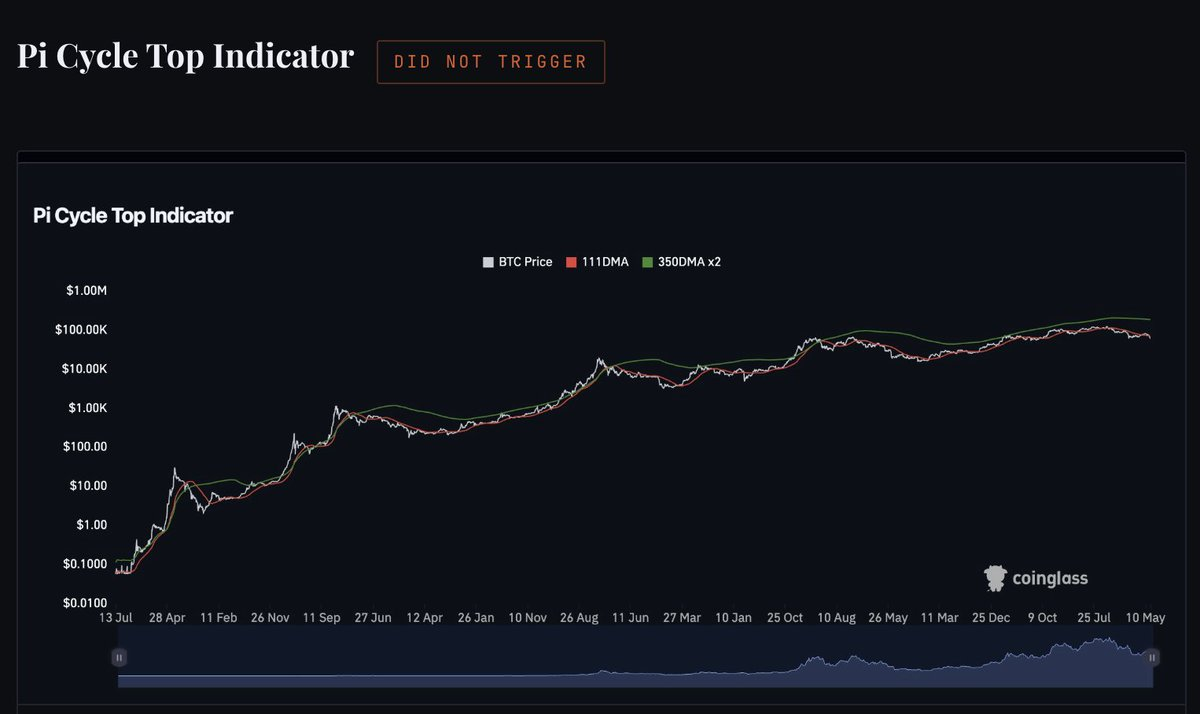
Pi Cycle Top Indicator: The 111-day moving average (DMA) has never crossed above twice the 350-day moving average (350-DMA×2). In past tops, this cross often occurred within days of the actual peak (data source: Coinglass)
When the 111-day moving average crosses above twice the 350-day moving average, the Pi Cycle indicator is triggered. It is one of Bitcoin's most accurate top signals in history, having hit windows just days before the actual peaks in 2013, 2017, and 2021. Many analysts predicted this crossing would occur in September 2025.
But this did not happen. The two lines approached each other and then diverged without crossing. The reason directly ties back to the logic of institutional demand: a Pi Cycle cross requires prices to experience sharp and accelerated increases, pushing the short-term averages above the long-term averages. Institutional buyers operating on a quarterly allocation timeline will not generate this acceleration. What they bring is stability and persistence in price rises. Rising from $40,000 to $126,000 over 20 months, while the total increase may be as gigantic as retail-driven parabolic surges, the angle of ascent is completely different, and it is this angle that the Pi Cycle indicator measures. Since the angle of ascent does not meet triggering conditions, even though a historical high was ultimately reached, the indicator remained inactive.
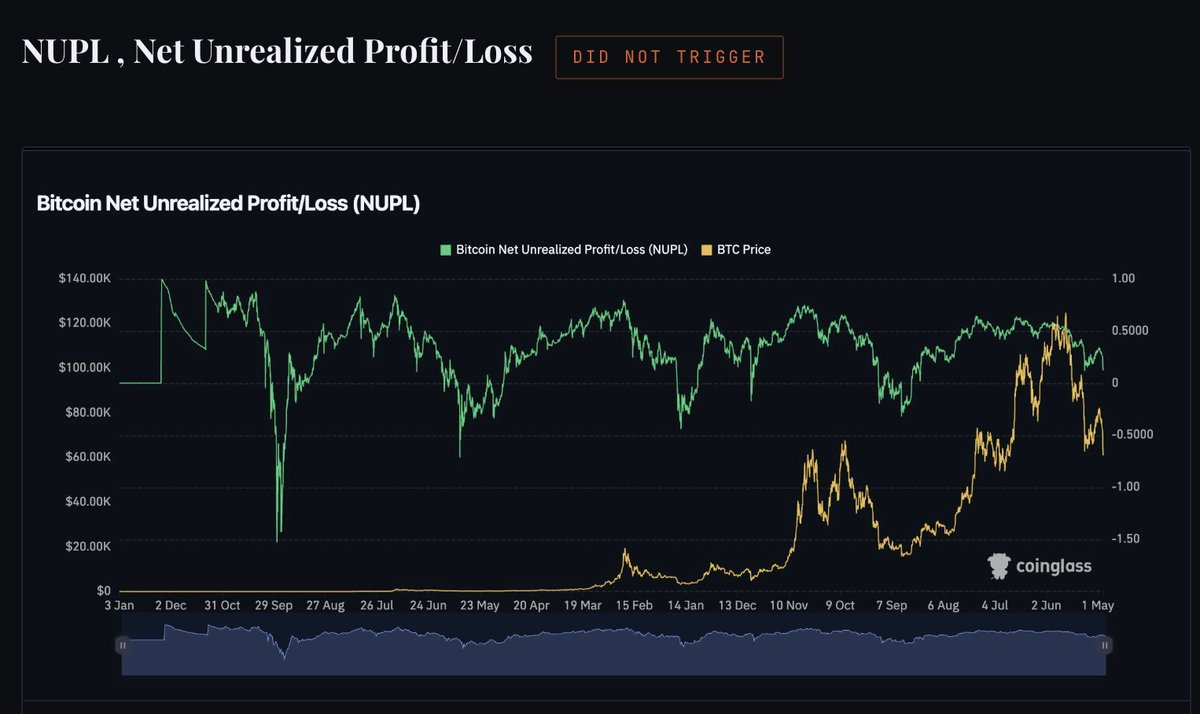
Bitcoin's NUPL: Never exceeded 0.75 (Frenzy Zone) at the top in 2025. Previous cycle peaks soared far above this threshold (data source: Coinglass)
NUPL measures the ratio of unrealized profits to unrealized losses across the entire Bitcoin network. When this number exceeds 0.75, the market is deemed to be in a frenzied state. In such a state, the vast majority of holders enjoy considerable profits, significantly increasing the likelihood of large-scale sell-offs. At past cycle tops, NUPL plummeted deep into the frenzy zone, in some cases approaching 1.0.
At the October 2025 peak, NUPL peaked only around 0.60 to 0.65. This indicator reflects the market as being in a state of belief, filled with confidence but not frenzy, and for the holders it can monitor, this reading is accurate. The long-term Bitcoin holders who accumulated during 2022 and 2023 are very disciplined. They are not the panic profit-takers needed for the frenzied readings. And those retail participants who should have pushed NUPL into the danger zone did not buy Bitcoin; they went to speculate on Memecoins. NUPL accurately describes the state of the on-chain holders it can measure, but it does not see the $63 billion lying in ETF custodial institutions.
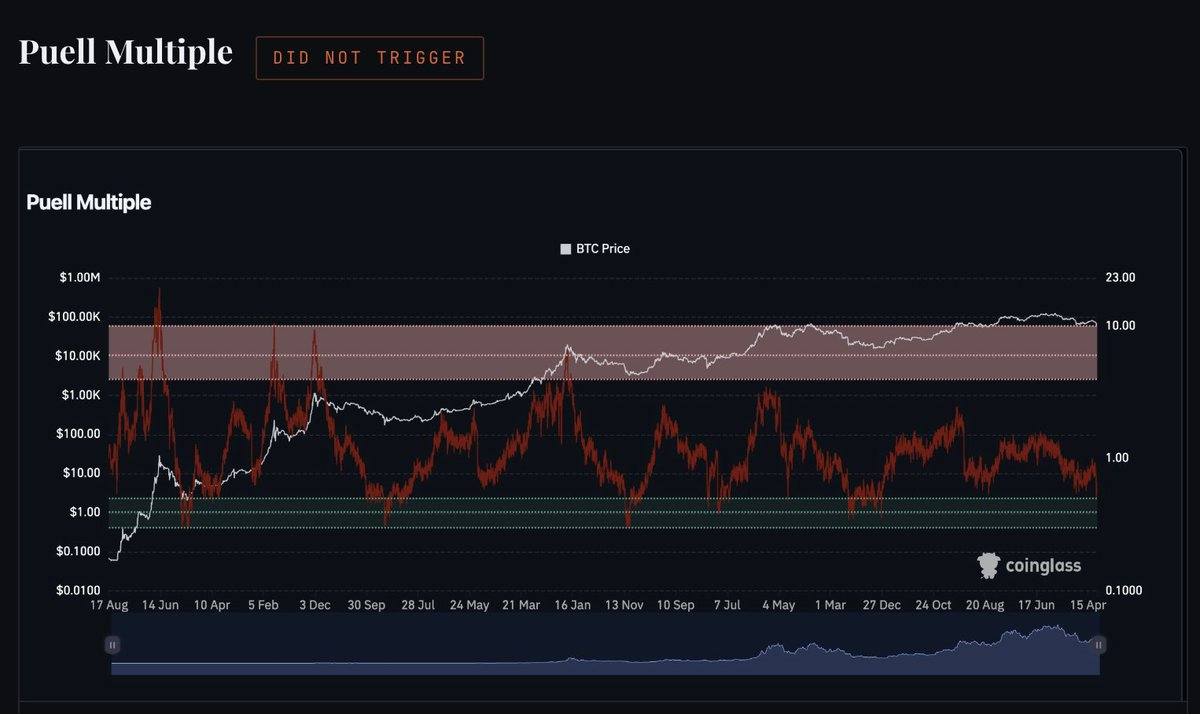
Puell Multiple: Has remained around 1.0 throughout the 2025 bull market. Historical peak readings were 3.4, 6.6, and 10.48 (data source: Coinglass)
The Bitcoin Puell Multiple compares miners' daily revenue to their 365-day average. When miners' income vastly exceeds their annual average (usually due to price surges), they will actively sell to lock in profits, causing supply pressure, which historically often marks cycle tops. Past peak readings: 10.48 in 2013, 6.6 in 2017, and 3.4 in 2021. This trend itself has been declining across cycles.
In 2025, due to the halving in April 2024 reducing the block reward from 6.25 BTC to 3.125 BTC, miner revenue per block level has structurally been below previous cycles. While the price of Bitcoin has doubled, the halving has reduced the number of tokens miners receive. Consequently, the Puell Multiple has rarely exceeded 1.0. In addition to the mathematical logic of the halving, the nature of modern mining has radically changed from what it was in 2013 or 2017. Large publicly-listed mining companies will hedge risk, have institutional-level fund management systems, and do not need to dump tokens during price peaks like early miners did. This indicator has been tailored to a mining industry that no longer exists in the same form, and with each halving, its significance diminishes.
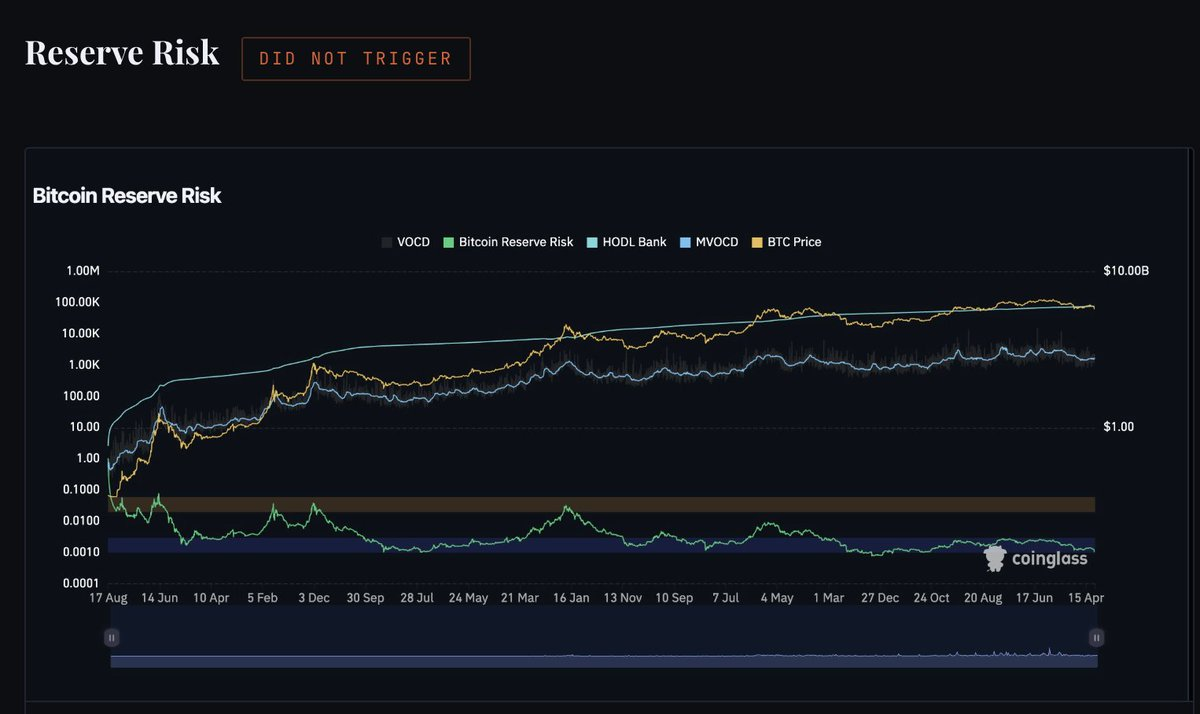
Bitcoin's Reserve Risk: Remained deeply in the accumulation zone throughout the 2025 bull market. Never approached the orange or red zones (data source: Coinglass)
Reserve Risk measures the confidence of long-term holders relative to current prices. When a long-term holder decides to sell after holding for a time, the held opportunity cost (i.e., HODL bank) is released. When many long-term holders simultaneously sell at high prices, Reserve Risk skyrockets into the danger zone. At past cycle tops, as long-term holders eventually capitulate to profit-taking, this indicator has always entered the orange and red zones.
In 2025, Reserve Risk remained deeply in the accumulation zone throughout the bull market. Long-term holders hardly made large-scale sell-offs sufficient to move the indicator. This is the most direct fingerprint of the institutional era: the largest holders come from ETF custodial institutions, Strategy company, and long-term retail that survived through the 2022 bear market, all of whom continued to hold firmly throughout the rally. They are not the impulsive sellers, so they did not push the Reserve Risk into the red zone. The indicator accurately measures their behavior; it just behaves extremely rationally and disciplined in price ranges that historically would trigger large-scale sell-offs.
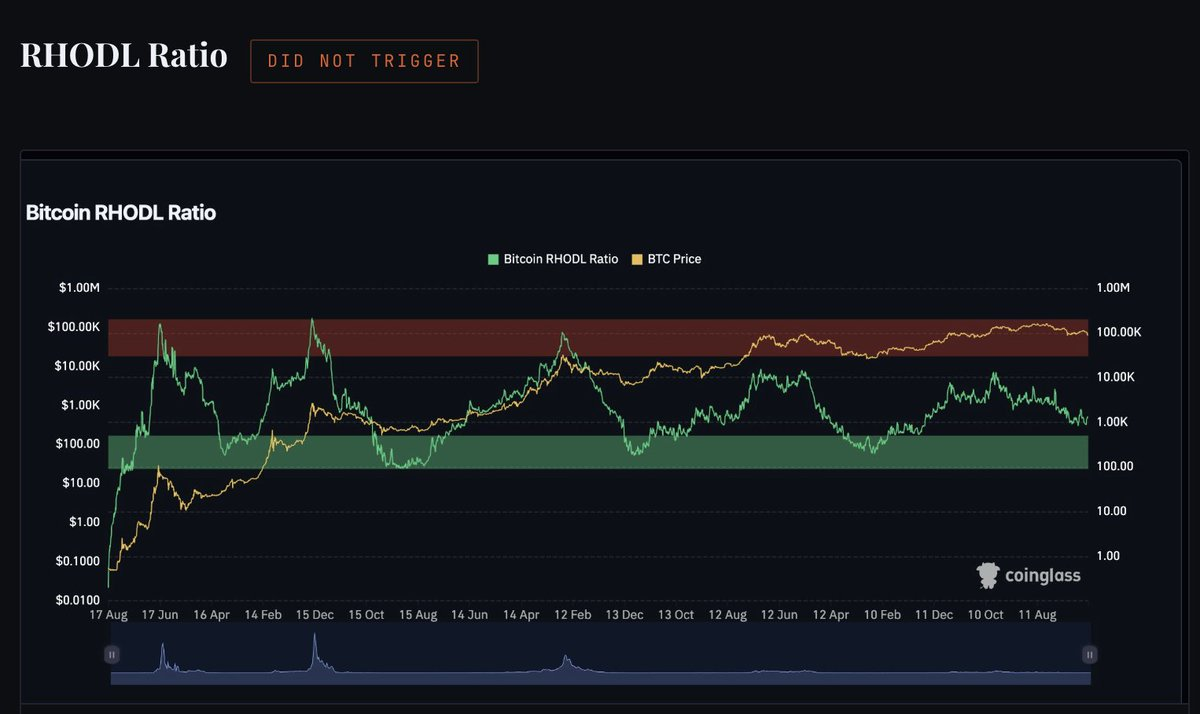
Bitcoin's RHODL ratio: Rose from a low point but never entered the historical red zone typically associated with cycle tops (data source: Coinglass)
The RHODL ratio compares the realized wealth of tokens that moved in the past week to those that have not moved for 1 to 2 years. A high ratio means the market is dominated by new capital, that is, new buyers who just entered at high prices. This is characteristic of a typical frenzied top: late retail funds flooding in at the peak. In every previous cycle top, as new entrants surged into the market in the last weeks, this indicator would enter the red zone.
In 2025, RHODL increased from the bear market low but never entered the red zone. The fresh capital needed to push this indicator to extremes simply wasn't in Bitcoin but in Memecoins. The retail FOMO sentiment measured by RHODL shifted to a completely different part of the crypto market and vanished there, rather than in Bitcoin. RHODL accurately described the current situation: at the top, new retail funds did not dominate the Bitcoin market. The only flaw is that this indicator is oblivious to the $63 billion lying in the ETF custodial institutions.
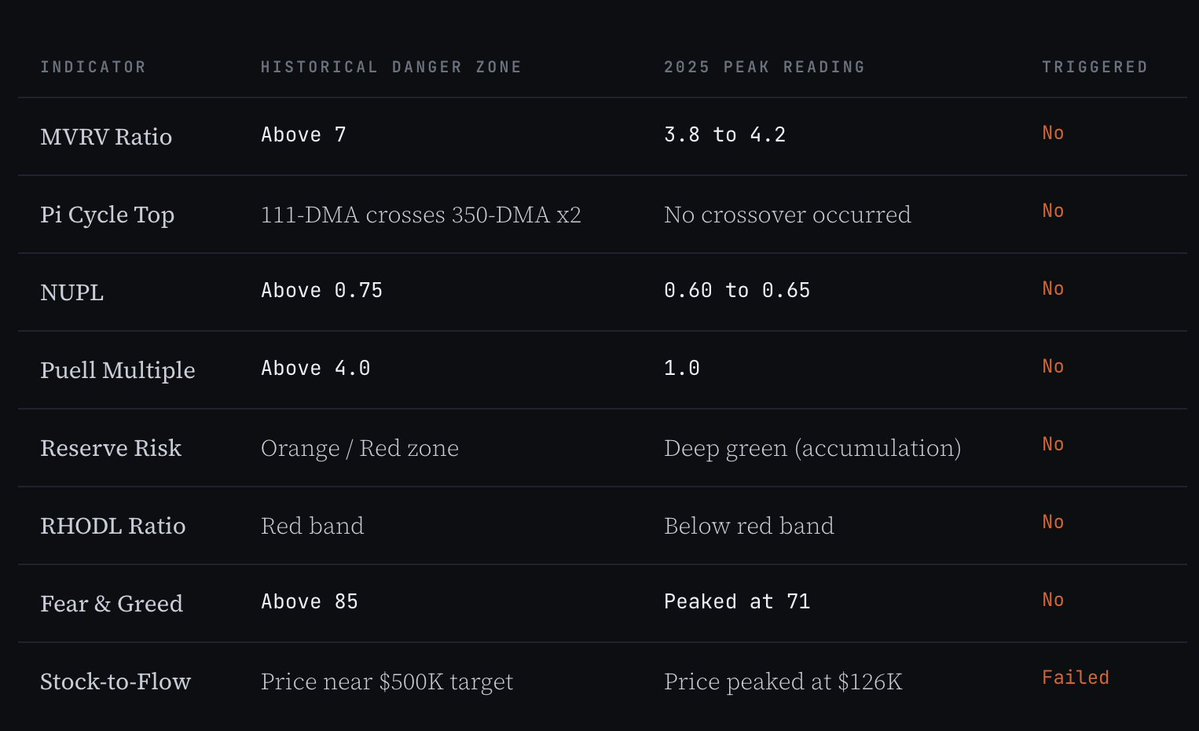
Reviewing the performance of these eight indicators at a peak of a cycle, the conclusion drawn is not that the indicators malfunctioned. Rather, they accurately measured a market no longer exhibiting the retail-dominated structure they were applicable to. All these tools were designed during an era when Bitcoin’s price was almost entirely driven by retail speculation. They were tuned to detect retail frenzy. But in this cycle, retail frenzy has not occurred in Bitcoin. These tools have accurately reported this fact. The only mistake was the assumption that the typical retail frenzied surge was the only way to recognize a cycle top.
Ultimately, the cycle did reach a top. It just did so in an institutional manner, slowly, without fireworks, and without triggering any alarms.
Nothing works except the cycle itself
After examining all available indicators in this cycle, we arrive at an honest conclusion: Almost none of the indicators provided a reliable peak signal.
On-chain indicators collectively fell silent: MVRV, Pi Cycle, NUPL, Puell, Reserve Risk, and RHODL all failed to enter danger zones at their peaks. Many macro indicators analyzed: global M2 money supply and the dollar index (DXY) also collapsed in an unreliable manner. Global M2 continued to rise after Bitcoin peaked in October 2025, indicating that this correlation faltered precisely at the time it should have worked most effectively. And the correlation with DXY? Despite DXY recording one of its worst annual performances in decades in 2025 (falling about 11% to 12%), which should have been a tailwind, Bitcoin still closed with negative returns by the end of 2025. This correlation has failed in both directions.
So what triggered it? Simply the timing of the 4-year cycle. If you just circle October 2025 on the calendar (one year after the halving, aligning with previous cycle peak timing patterns of 2013, 2017, and 2021), you're spot on. This is not based on any complex analysis of on-chain data or macro correlations, just because the clock of the cycle struck at the right time.
This is the unsettling conclusion this cycle forces us to confront. The tools we built to identify peaks, the macro correlations we considered reliable, and the sentiment indicators we obsessively monitored were not triggered. The only thing that worked was the simplest thing: the 4-year halving cycle time that has remained unchanged since 2012.
What will the next cycle bring? No one can be sure. In 2020, people expected institutional purchases or the halving itself to drive gains. But what happened was a global pandemic, trillions of dollars printed, and an unforeseen wave of risk asset euphoria. The specific catalysts that will drive the 2028 to 2029 cycle could be anything: an AI bubble bursting leading liquidity back to the crypto market, new US crypto regulations unlocking institutional capital, a Federal Reserve pivot triggered by a recession, or something no one has thought of yet. Attempting to predict specific causes may be futile. History tells us that cycles will continue to exist. It’s just that their specific mechanisms will surprise everyone.
Currently in mid-bear market, yet to bottom
Bitcoin's current trading price is between $62,000 and $63,000. This is about 50% lower than the historical high of $126,296 set in October 2025. The current market structure exhibits characteristics of a mid-bear market, yet it has not bottomed out, nor is it in free fall.
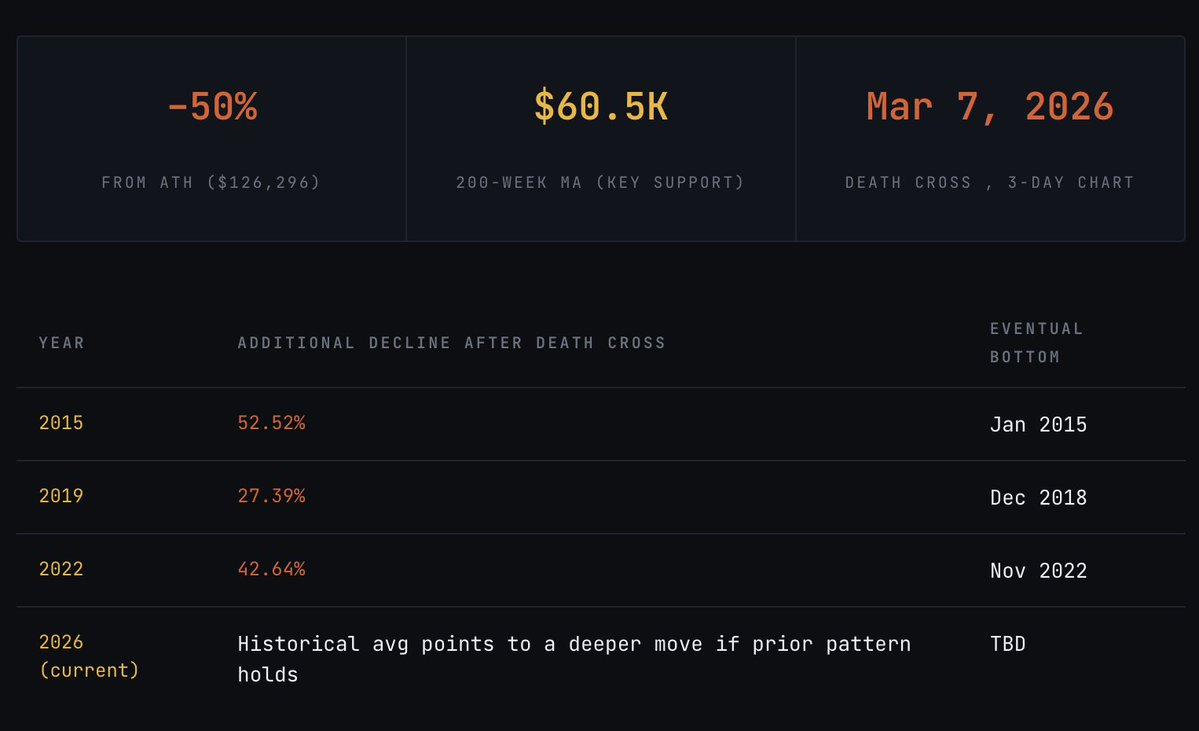
The most structurally significant position at the moment is the 200-week moving average (EMA 200), approximately at $68,832 on the weekly chart. Throughout each previous bear market, Bitcoin found its bottom support at or near this level. In the bear markets of 2015 and 2022, Bitcoin consolidated around the weekly 200 EMA before starting the next bull run. The 200-week MA is not a precise bottom signal; it is a zone. Historically, Bitcoin has dipped slightly below this line before reversing, testing the market's resolve before starting the next accumulation phase.
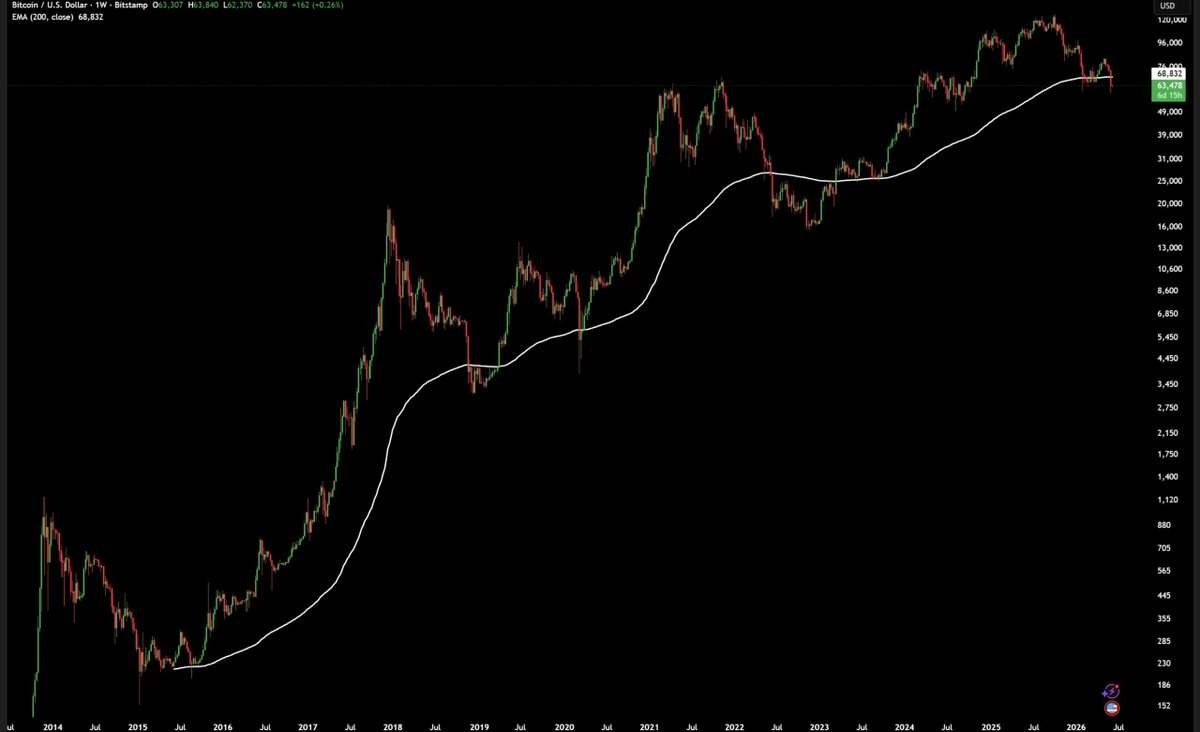
Bitcoin weekly chart with the 200 EMA: Each bear market cycle found support at or near this level before opening the next bull market (data source: Bitstamp).
On March 7, 2026, a death cross formed on Bitcoin's 3-day chart. This matches the signals seen before major declines in 2014, 2018, and 2022. Reviewing Bitcoin's drop after previous 3-day death crosses:
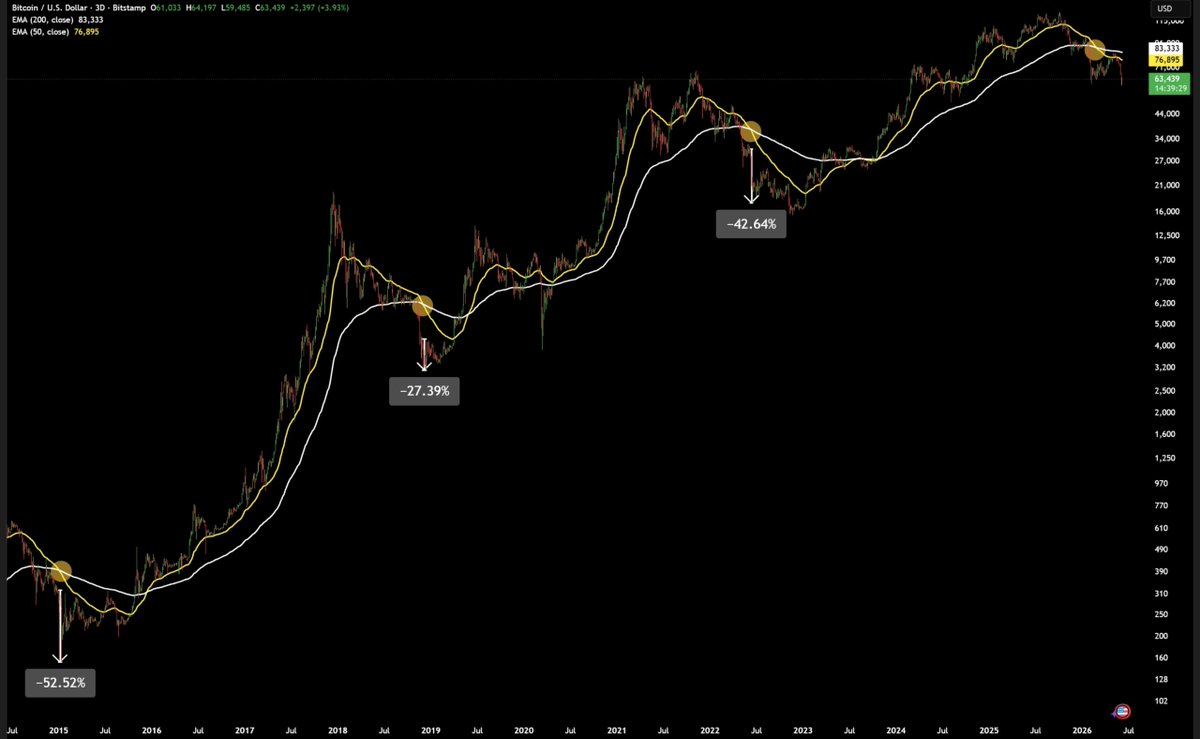
Bitcoin's 3-day chart: On March 7, 2026, EMA 50 crossed below EMA 200 (death cross). Previously, death crosses resulted in declines of 27%, 43%, and 53% from the crossing point (data source: Bitstamp).
The pessimistic prediction is that, if the 200-week MA fails to hold and the average decline associated with historical death crosses applies, the price could point towards $33,000 to $35,000. This is a number to keep in mind in a bearish scenario.
The benchmark scenario is that, considering the trend of diminishing declines across cycles, and the presence of institutional buying support not seen in previous bear markets, the bottom could be between $45,000 and $55,000. In terms of timing, applying historical rhythms from the top to the bottom, the bottom points to the third to fourth quarter of 2026, especially October to November 2026, about one year from the peak.
What does a confirmed bottom look like? Bitcoin closed above the 200-week MA for three consecutive weeks or longer on the weekly chart. ETF outflows begin to stabilize after experiencing continuous withdrawals. The Fear and Greed Index rebounds from below 15 and stays above 25 for at least two weeks. When these conditions are met together, rather than a single price level, it signals that the accumulation phase has begun.
Bottoming in 2026, peaking in 2029?
Once the current bear market phase ends, the cycle framework will point to the following sequence:
Q3 to Q4 2026: Bitcoin bottoms out. The 200-week MA and about $54,000 realized price form a support band. Historically, this is the best accumulation zone in any cycle— a period of extreme pessimism before the next round of expansion begins. This is also when most retail investors who entered near the peak abandon and sell their holdings, transferring tokens at discounted prices to long-term holders.
2026 to 2027: Accumulation phase. The price movement is sideways, boring, and highly volatile. No major headlines or momentum. This phase feels like nothing is happening, which is why most people miss it. Every previous cycle has had a phase that is completely identical between the bear market bottom and the start of the next bull market.
April 2028: The next halving. Block rewards drop from 3.125 BTC to 1.5625 BTC. Miner sell pressure is halved again. Institutional demand from ETFs (now much larger than today) begins to absorb supply shocks. Bitcoin starts to build momentum.
2028 to 2029: Expansion post-halving. If the 4-year cycle remains valid, this will be the next major bull market. Based on consistent timing patterns, the peak in 2029 is most likely to occur in the third or fourth quarter of that year.
One important point: The cycle in 2025 indicates that the kind of frenzied peak behavior that has driven past cycle peaks may no longer happen in the same way. As the share of Bitcoin owned by institutions continues to grow, while retail's participation shrinks in total demand, the arrival of the top may still not coincide with extreme indicator readings, parabolic price movements, or the obvious cycle top signals easily identifiable in the past. To cash out at the next top, you will need to rely on different tools than those that worked in 2021.
Conclusion
Bitcoin's 4-year cycle has not been broken. The top arrived as expected, occurring at the correct timing of the halving cycle, and the price exceeded the previous high, setting a new all-time high. The operation of the cycle completely aligns with expectations.
What has failed are the tools people used to identify the peaks. Every classic on-chain indicator fell silent because every classic on-chain indicator measured retail behavior, and retail was not in Bitcoin. Before retail capital reached Bitcoin, it had been systematically drained through Memecoins, celebrity tokens, and high FDV VC token structures. By October 2025, the retail fuel needed to drive frenzied peaks and trigger euphoric indicators had been entirely consumed.
Replacing retail are institutional buyers: ETFs, Strategy companies, professional asset allocators which produced a surge of 215% from the low of 2024 to the peak, but their operations did not lead to parabolic candles or trigger any alarms. The indicators showed everything was calm, yet the market still topped out.
The only factor that truly worked was the timing of the cycle itself. In October 2025, 535 days after the April 2024 halving, approximately one year from the period suggested for the cycle bottom, perfectly aligning with historical timing patterns. Not because of complex indicator analysis, but because the same 4-year structure that has remained unchanged since 2012 was once again validated.
Bitcoin is currently in a bear market phase consistent with all previous cycle peaks. The 200-week EMA serves as a structural reference level supporting all previous bear market bottoms. Upcoming trends will follow the cycle’s timing framework. The specific catalysts, characteristics of the market cycle, and whether old indicators will eventually trigger—these are unpredictable. The timing patterns are the only signal that has never failed.
免责声明:本文章仅代表作者个人观点,不代表本平台的立场和观点。本文章仅供信息分享,不构成对任何人的任何投资建议。用户与作者之间的任何争议,与本平台无关。如网页中刊载的文章或图片涉及侵权,请提供相关的权利证明和身份证明发送邮件到support@aicoin.com,本平台相关工作人员将会进行核查。


