Cryptocurrency Scholar: June 11 Bitcoin Dual Cycle Analysis! Daily chart clearly trending down, 4-hour fluctuations with clear long and short points! Latest market analysis and operational advice
The current price of Bitcoin is 61,700. Reviewing the current market conditions, it is easy to see that most losses come from going against the trend. Clearly, the moving averages and MACD all indicate a downtrend, but some insist on holding long positions; as soon as the rebound starts, panic selling occurs at the lowest point. Humans naturally dislike losses, so they are always reluctant to cut losses in time, but the market does not cater to anyone's emotions. The cryptocurrency world has never been about who makes more money in the short term, but rather who can successfully navigate through cycles of bull and bear markets. Controlling one’s actions and maintaining good risk management are fundamental for long-term survival, or as I do, setting stop losses while taking profits at highs and continuously eating the downtrend.
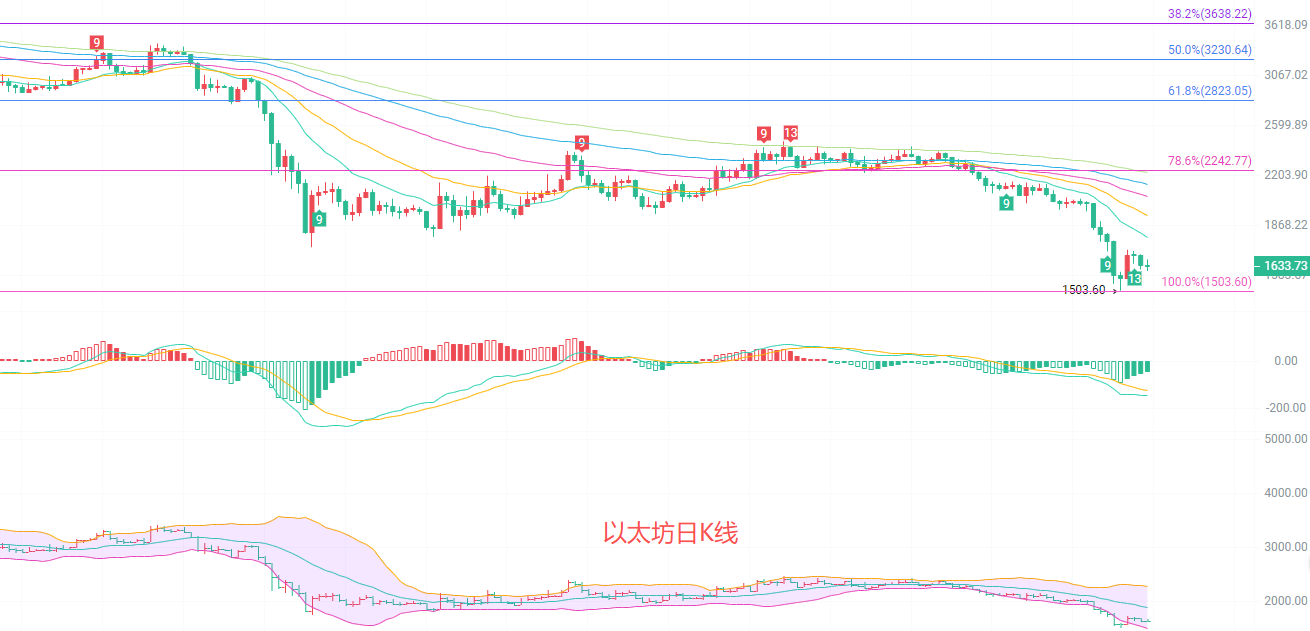
The daily candlestick chart is overall in a deep downtrend, with the moving average system all aligned downward. The EMA 15, 30, 60, 90, and 120 are all putting pressure on the price. The MACD’s DIF is significantly lower than the DEA, with green bars continually increasing in volume, and the downtrend momentum has not completely faded; the Bollinger Bands are opening downward, with prices running closely above the lower band of 57,173. The middle band at 69,467 is the mid-term bull-bear dividing line. There is no clear signal for a rebound on the daily level, with the major trend dominated by a downward direction, and any rebound only serves as a correction during the decline.
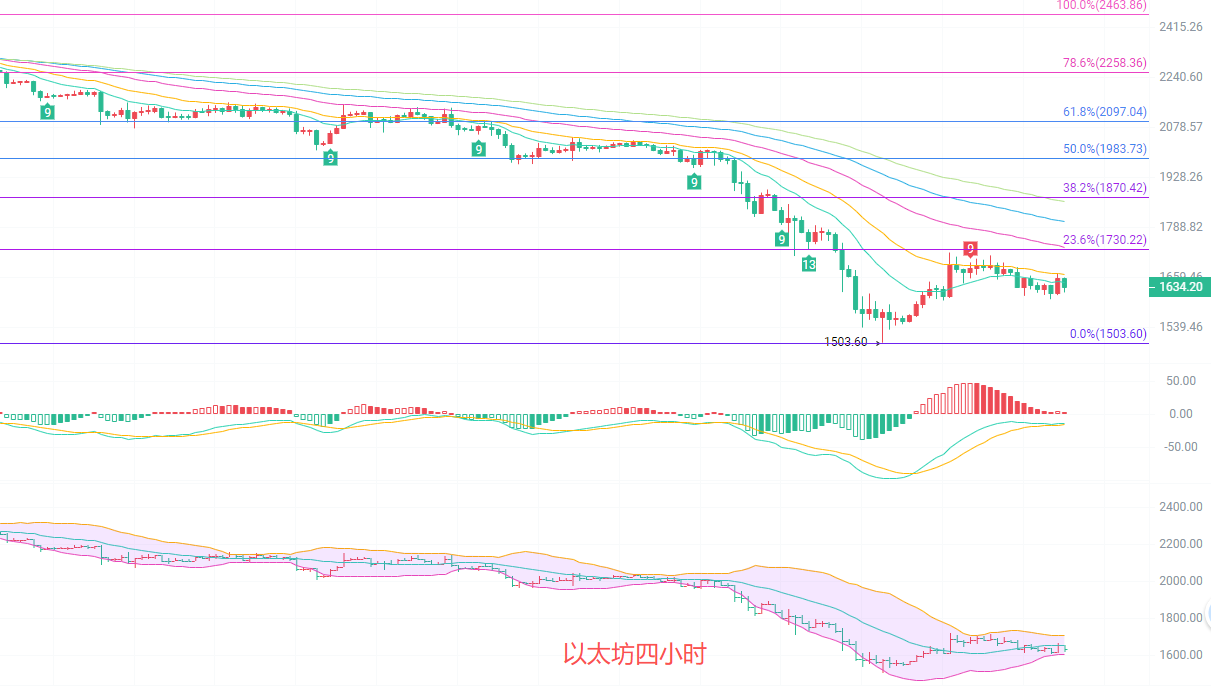
The four-hour candlestick chart shows a slight recovery fluctuation around the low point of 59,080. The short-term EMAs of 15 and 30 are above the price, while the medium-term moving averages of 60, 90, and 120 are all trending downward from high positions, maintaining the overall southward trend of the moving averages. The Fibonacci resistance levels at 0.236 are 64,684, and at 0.382 are 68,152, which restrict the rebound space. The 4-hour MACD shows a slight golden cross, with a decrease in volume for the red bars, indicating weak upward momentum; the Bollinger Bands are narrowing, with the upper band at 64,134 and the lower band at 60,755, while the price is stuck below the middle band at 62,444. Short-term, this signifies a weak sideways trend after an overshot decline, with limited heights for rebounds, making it difficult to change the long-term downtrend tone.
Short-term strategy reference: Follow the major cycle trend, with small stop losses for quick in-and-out trading
For upward movement from 61,000 to 60,500, stop loss at 60,000, target at 61,500 to 62,100
For downward movement from 62,100 to 62,600, stop loss at 63,100, target at 61,500 to 60,500
Specific operations should be based on real-time data from the market, and for more information, you can consult the author. The publication of the article may be delayed, advice is for reference only, and risk is to be borne by the reader.

Warm reminder: The above content is solely created by the author on Weibo. The ads at the end of the article and in the comment section are unrelated to the author, please identify them carefully. Thank you for reading.
免责声明:本文章仅代表作者个人观点,不代表本平台的立场和观点。本文章仅供信息分享,不构成对任何人的任何投资建议。用户与作者之间的任何争议,与本平台无关。如网页中刊载的文章或图片涉及侵权,请提供相关的权利证明和身份证明发送邮件到support@aicoin.com,本平台相关工作人员将会进行核查。


