Dear friends, I am Sister Qinglan. Today, the market sentiment has shown subtle changes, with the crypto fear index rising from 11 to 12. Although it remains in the extreme fear zone, it at least indicates that the selling pressure has eased. Meanwhile, SpaceX surged 19.22% on its first day of listing, with a market capitalization jumping to ninth globally. This strong performance in the traditional market has indirectly boosted risk appetite for crypto, and MSTR also rose 3.18%. But don’t be too optimistic just yet; Japanese interest rates are nearing a 30-year high, and the shadow of tightening global liquidity still looms. These two pieces of news tell us that the current market is at a critical juncture, with a tug-of-war between bulls and bears, and a direction could be chosen at any moment.
Current Price and Time
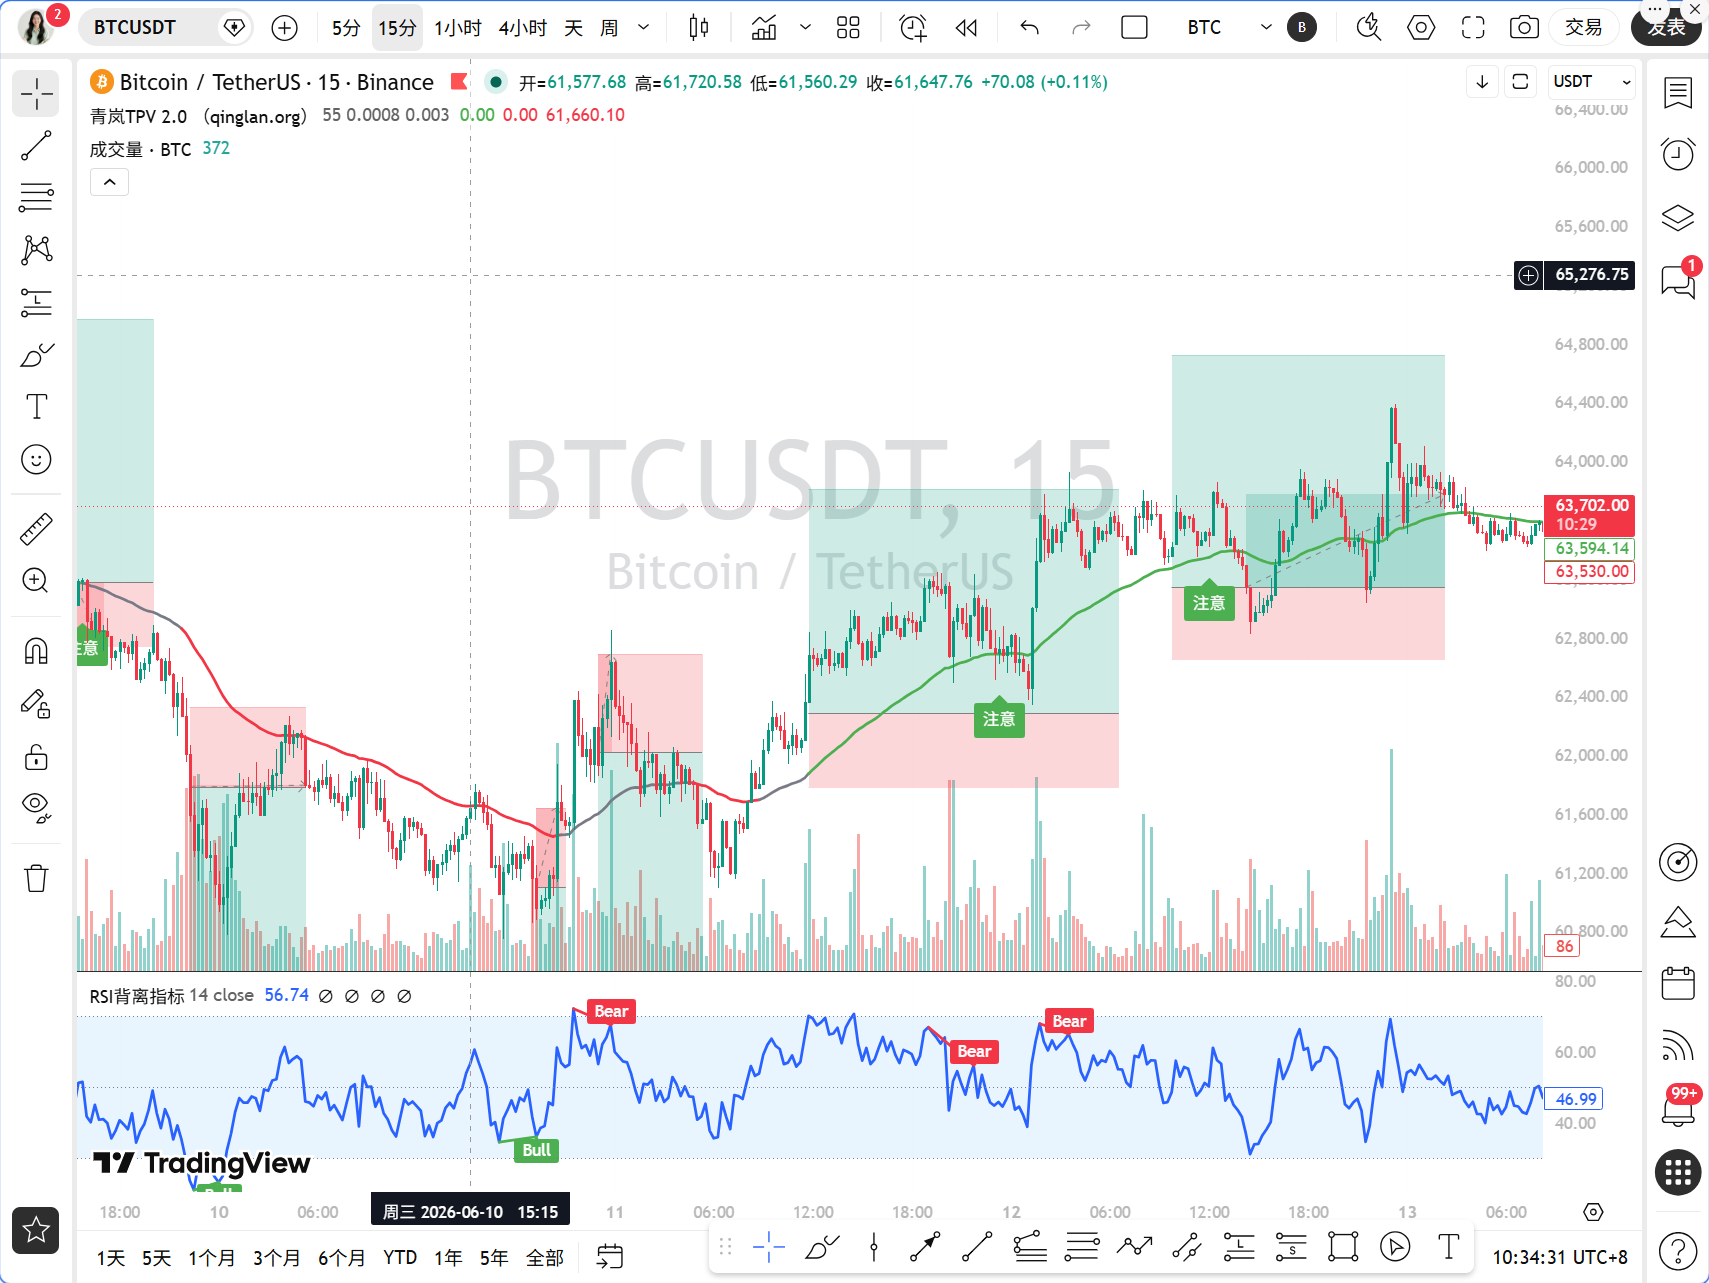
It is now June 13th at 10:34 AM, and the latest price of BTC is 63702 USDT. The 24-hour decline is only 0.07%, indicating a basic balance of bullish and bearish forces, but the extreme fear index of 12 means that retail sentiment is still weak, and any slight movement could trigger significant volatility.
Multi-Cycle Overview
First, looking at the daily chart, MA5=62829.80, MA10=62639.41, MA30=70804.14. The price barely stands above the short-term moving averages, but the long-term moving averages remain high. The MACD shows DIF=-3600.62, DEA=-3567.17, and a histogram of -33.46, indicating that while bearish momentum is weakening, it has not yet turned positive. RSI=23.96, in the oversold zone, showing a typical bottom-dulling characteristic, indicating that bearish forces are exhausting, but bulls are not yet ready for a counterattack.
On the 4-hour level, MA5=63646.06, MA10=63483.70, MA30=62815.28. The price is stable above the short-term moving averages. The MACD shows DIF=271.29, DEA=139.76, with a histogram of 131.53, indicating that bullish momentum continues to expand. RSI=68.48, close to the neutral and strong area, indicating that the rebound momentum on the 4-hour level is sufficient.
On the 1-hour level, MA5=63644.38, MA10=63629.16, MA30=63575.43. The price is running above all moving averages. The MACD shows DIF=107.02, DEA=128.99, with a histogram of -21.97. Note that there are signs of a top divergence here, as DIF is positive but the histogram is shortening, indicating that short-term upward momentum is weakening. RSI=54.13, in the neutral zone.
On the 15-minute level, MA5=63760.45, MA10=63683.03, MA30=63591.56. The price is oscillating above the moving averages. The MACD shows DIF=35.32, DEA=10.78, with a histogram of 24.54. Bullish momentum is still present but weakening. RSI=68.06, close to the overbought area, indicating a short-term need for a pullback.
TPV Signal Verification
According to the Qinglan TPV system, we take 1-hour EMA55=63202.60 as the boundary between bulls and bears. The current price of 63702 is far above EMA55, and the closing prices of the last 8 1-hour candles are all greater than EMA55, with a crossing count of 0, and the distance from EMA55 is 0.79%, not meeting the oscillation threshold, indicating that it is currently in a bullish trend area.
Long Conditions Verification: First, the price is stable above 1-hour EMA55, with two consecutive candle closing prices greater than EMA55; this condition is met. Second, support is stabilizing, with the last pullback low around 63200, just touching EMA55 before rebounding, creating effective support. Third, the bearish momentum is exhausting, as the 4-hour MACD histogram continues to expand, but the 1-hour MACD histogram shows shortening, indicating a need to be cautious of a short-term pullback. Overall, the bullish trend is established, but short-term momentum is diminishing, and chasing highs is not advisable.
Short Conditions Verification: First, the price is under pressure below 1-hour EMA55; the current price is far above EMA55, not meeting this condition. Second, the pressure meets resistance; currently, there is no formation of a top pattern or long upper shadow. Third, the rebound is weak; although the 1-hour MACD histogram is shortening, it is still above the zero axis, and RSI has not entered the overbought area. Therefore, the short conditions are not established.
Oscillation Handling: The last 8 1-hour candle closing prices are all above EMA55, with a crossing count of 0 and a distance of 0.79%, not meeting the oscillation conditions; it is currently in a unilateral bullish trend.
On-chain/Funding Situation
The fear and greed index is at 12, indicating extreme fear and extreme pessimism among retail investors, which is often a typical feature of a bottom area. BTC's market share is 56.44%, maintaining a high level, indicating that funds are still concentrating on BTC, and altcoin liquidity is insufficient. On-chain data shows that the activity of large transfers has decreased, but the BTC balance on exchanges continues to decrease, indicating that long-term holders are still accumulating. Galaxy Research predicts that the bottom of this cycle is higher than before, raising the long-term bottom, which provides confidence support for bulls.
Key Attack and Defense Levels
Upper resistance levels: 64000 is a psychological pressure point; 64500 is a previous high congestion zone; 65000 is the previous high on the 4-hour level. Lower support levels: 63200 is the 1-hour EMA55, the boundary between bulls and bears; 62800 is the 4-hour MA30; 62000 is the resonance support of the daily MA5 and MA10. If the price breaks below 63200, the bullish trend may turn to oscillation.
Trading Ideas
Direction: Cautiously bullish, but wait for a pullback to enter.
Entry Conditions: Wait for the price to pull back near the 1-hour EMA55, specifically in the 63200-63300 range, showing a long lower shadow or bottom pattern, and the 15-minute MACD histogram changes from green to red, while RSI rebounds from below 30. If it directly rushes to 64000, it is not recommended to chase long because the 1-hour MACD histogram is shortening, and chasing highs carries significant risk.
Stop Loss Level: Break below the 63000 psychological level, that is, below the daily MA5, stop loss and exit.
Target Levels: The first target is 64000, the second target is 64500, the third target is 65000. If the price breaks through 65000 and stabilizes, it can look towards 66000.
If the price breaks below 63200 and closes below EMA55 for two consecutive 1-hour candles, then shift to a wait-and-see approach and wait for confirmation of the oscillation range.
Risk Warning
Under extreme fear conditions, the market is prone to false breakouts and sharp rises and falls, it is essential to control position sizes and implement strict stop losses.
Follow Qinglan Crypto Classroom for more trading opportunities! Welcome to visit the official website www.qinglan.org
📊 Qinglan TPV Trading Strategy Backtest Reference
🕒 Last Backtest Time 06-13 07:00:02
Total Analysis: 2209 Backtests: 1794 Accuracy Rate: 70.1% (1258/1794)
免责声明:本文章仅代表作者个人观点,不代表本平台的立场和观点。本文章仅供信息分享,不构成对任何人的任何投资建议。用户与作者之间的任何争议,与本平台无关。如网页中刊载的文章或图片涉及侵权,请提供相关的权利证明和身份证明发送邮件到support@aicoin.com,本平台相关工作人员将会进行核查。