Cryptocurrency Academy: On July 29, the correction rebound of Ethereum (ETH) is nearing its end. If the critical resistance level comes under pressure, will it retest? Latest market analysis reference
The current price of Ethereum is 1910. Many northern traders have been feeling anxious these past few days, torn between whether to take profits after buying at a low or afraid of missing out and getting stuck if they chase high prices. This round of rebound initiated from the low of 1503, with the price touching around 1904 and then entering a period of consolidation. Many traders cannot distinguish whether this is just a corrective rebound in a downtrend or the beginning of a new uptrend. In the short term, the tug-of-war between bulls and bears is intensifying, and casually following trends can easily lead to losses. Trading is most dangerous when relying on feelings; understanding the cycle structure and identifying key support and resistance is essential to avoid traps in choppy market conditions.
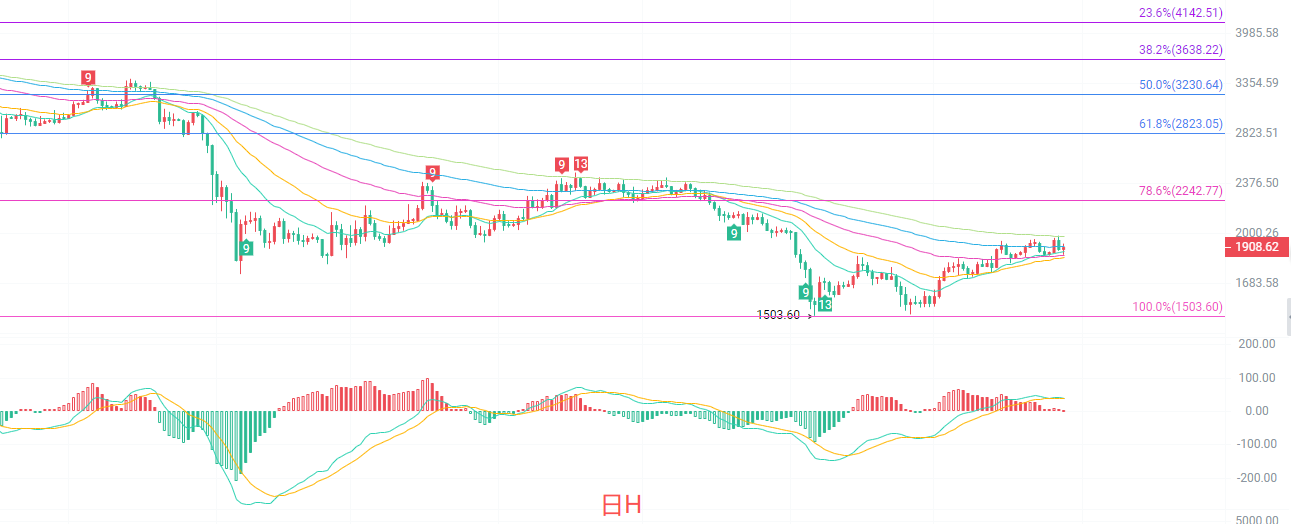
The daily candlestick chart is in the recovery phase after a decline. The price is stabilized above the EMA30 moving average but is under pressure at the Fibonacci 78.6% resistance level of 2242. The Bollinger Bands are gradually flattening, indicating a shift from a one-sided decline to a range-bound consolidation; the MACD indicator shows a continuous shrinkage of red columns, and bullish momentum is starting to wane. The overall trend at the daily level remains bearish, currently only defined as a bear market rebound, with primary resistance at 1980 and core support at 1853. If the previous high cannot be effectively broken, the rebound space will remain limited, cautioning against the risk of pullbacks after a surge.
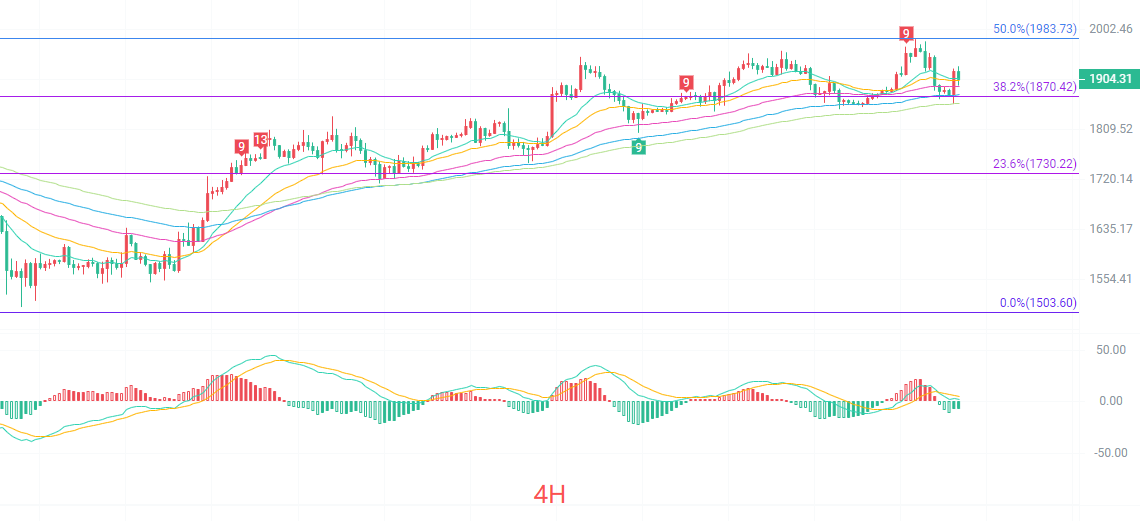
The four-hour candlestick chart is currently fluctuating below the Fibonacci 38.2% resistance level. The moving average system is entangled, and there is no clear direction for bulls or bears. The Bollinger Bands are squeezing, indicating that short-term volatility will narrow, and a change in trend is approaching. The MACD has formed a death cross, and short-term bullish strength has diminished, with short-term resistance in the range of 1930-1970 and support at 1870 and 1843. Currently, the four-hour chart has not established a clear upward structure and is in a high-level consolidation after the rebound. Only a breakout above 1982 can open up upward space, while a fall below 1843 would undermine the current rebound structure.
Short-term reference:
If the price does not break below 1880 to 1840, go long, with a stop-loss at 1800 and a target of 1950 to 1980.
If the price does not break below 1980 to 2020, go short, with a stop-loss at 2050 and a target of 1930 to 1890.
Specific actions should be based on real-time market data. For more information, you can consult the author. The publication of this article may have delays, and it is advised to use it as a reference at your own risk.

Warm reminder: The above content is solely created by the author of the public account. The advertisements at the end of the article and in the comments section are not related to the author. Please be cautious in distinguishing them. Thank you for reading.
免责声明:本文章仅代表作者个人观点,不代表本平台的立场和观点。本文章仅供信息分享,不构成对任何人的任何投资建议。用户与作者之间的任何争议,与本平台无关。如网页中刊载的文章或图片涉及侵权,请提供相关的权利证明和身份证明发送邮件到support@aicoin.com,本平台相关工作人员将会进行核查。


