Good morning, teammates, I am Sister Qinglan.
This morning's focal news can be said to be "a tale of two extremes." On one side, the escalation of the US-Iran conflict has led to soaring oil prices and heightened risk aversion; on the other side, SK Hynix's earnings report fell short of expectations, resulting in a sharp drop in US tech stocks, with concerns about a slowdown in AI demand spreading. The combination of these two negative news items has directly doused cold water on the crypto market. BTC's rebound momentum over the weekend has been interrupted, and it is currently at a very delicate juncture.
Current time: July 29, 09:39
BTC price: 63902 USDT
First, let’s observe the multi-period status to set the overall direction.
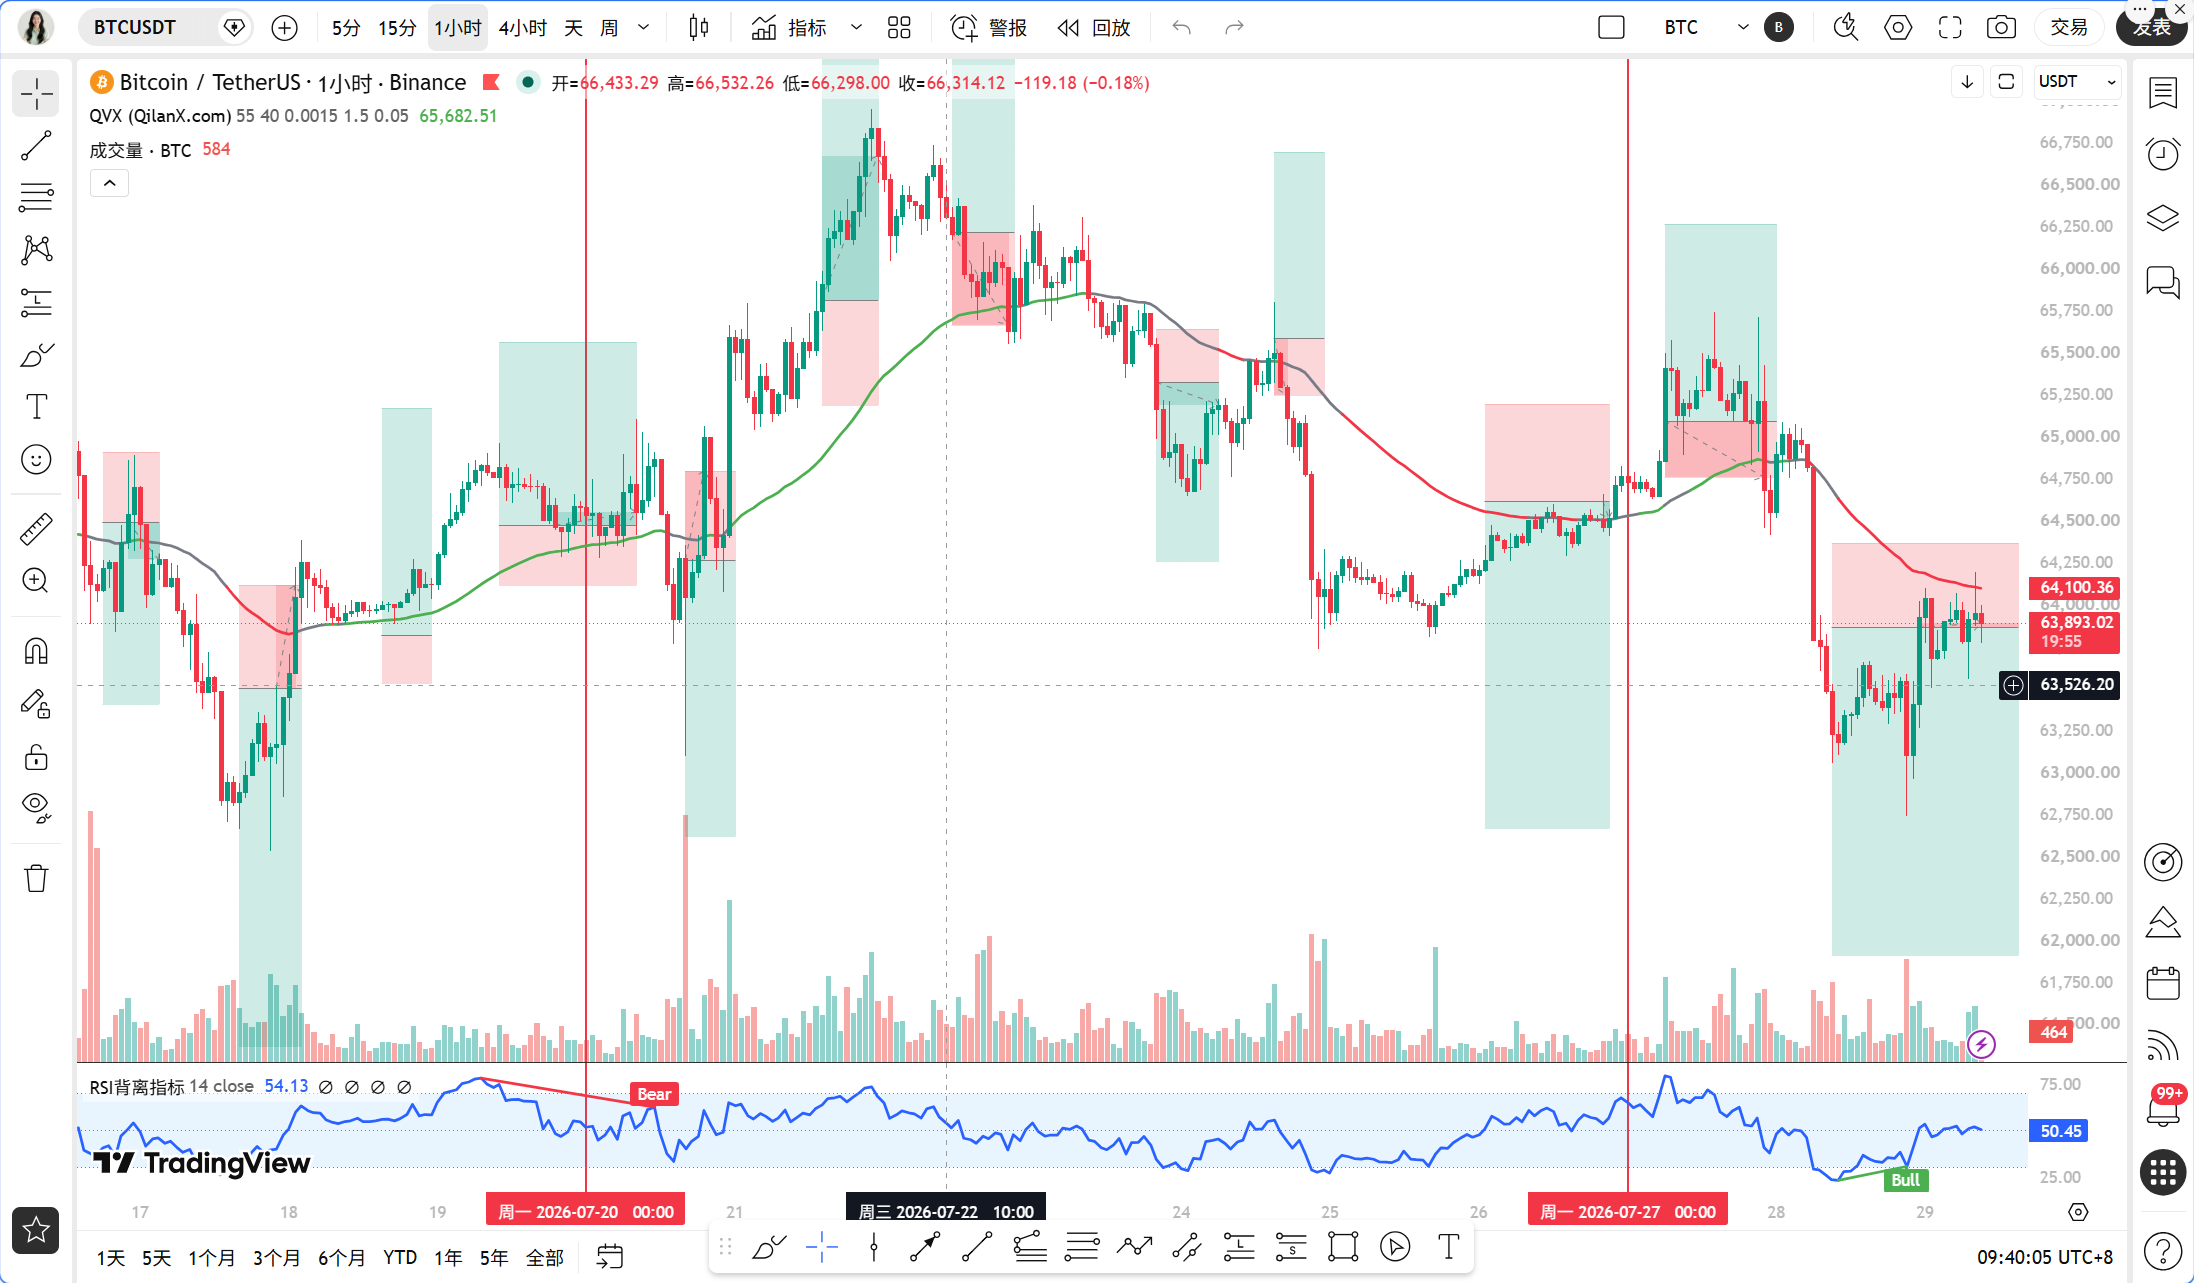
On the daily level, the price is below MA5 and MA10, the MACD bars are still in the negative zone, the DIF and DEA have crossed at the zero line, and the RSI is only at 45.43, indicating an overall weak oscillating pattern. The 4-hour level is more evident, with the MACD bars remaining negative, and the DIF and DEA below the zero line, indicating that bearish momentum is still being released. At the 1-hour level, although the price has risen above MA5, MA10, and MA30, the EMA55 is at 64092, and the price is just below it. Though the MACD bars have turned positive, the DIF and DEA are still below the zero line. At the 15-minute level, the MACD bars have turned negative, and the RSI has dropped to 46.29, indicating insufficient short-term momentum.
In summary: The larger cycles are bearish, the smaller cycles show an attempt to rebound, but the strength is insufficient, and the battle between bulls and bears is fierce.
Next, we will use the Qinglan TPV system to verify the signals.
First, let’s look at trend positioning. The current price is 63902, which is below the 1-hour EMA55 of 64092, so the system determines it is in the "bearish trend zone." This is crucial, indicating that the short-term rebound is simply a correction under the bearish trend.
Then, let’s look at the conditions for going long. Condition one, the price must stabilize above EMA55, requiring two consecutive 1-hour candlestick closing prices greater than 64092. The first one has not closed yet and does not meet this condition. Condition two, support must stabilize. Last night, the price rebounded from around 63600 and did show a long lower shadow, but the rebound peak was just suppressed by EMA55, and the strength of this support needs further confirmation. Condition three, bearish momentum must weaken. Although the 1-hour MACD bars have been positive consecutively, the 15-minute MACD bars have turned negative, indicating that the short-term momentum is beginning to weaken. Overall, the conditions for going long are not mature.
Now let’s look at the conditions for going short. Condition one, the price is under pressure below EMA55, currently satisfied. Condition two, resistance is encountered. The price has repeatedly attempted to break through the 63900-64000 range but had failed, showing signs of resistance with upper shadows appearing on the 1-hour candlestick. Condition three, the rebound lacks strength. The 15-minute MACD bars have turned negative, and RSI has fallen, indicating that the rebound momentum is waning. Overall, the conditions for going short are gradually forming, but a confirmation candlestick is still needed.
Next, let’s examine the oscillation auxiliary data. In the past 8 1-hour candlesticks, the number of closing prices above EMA55 is 0, and the crossing times are 0. However, the price's distance from EMA55 is only 0.30%, indicating tight fluctuations. The system suggests "increased oscillation probability." This means that although the trend is bearish, there is significant risk in directly chasing shorts, and the price could fluctuate around EMA55.
On-chain data shows that the Fear and Greed Index is only 29, which falls into the "fear" range. This typically indicates extremely pessimistic market sentiment, often characteristic of a short-term bottom. However, sentiment indicators are lagging and cannot be used as entry criteria. BTC's market share is 56.39%, indicating that funds are still seeking safety in BTC, while the liquidity of altcoins is even worse.
Key offensive and defensive positions are important for everyone to remember. The first resistance level above is the 1-hour EMA55 at 64092. If a strong breakthrough and stabilization at this position occurs, the bulls will have the chance to challenge 64500. The first support level below is at 63600, which is the starting point of last night's rebound. If it breaks below 63600, the next support is at the integer level of 63000.
Finally, let me summarize the trading thoughts for everyone.
Direction: Short-term bearish, but do not chase shorts; wait for short-selling opportunities after a failed rebound.
Entry conditions: Wait for the price to rebound to the 63950-64050 range, and observe whether the 1-hour candlestick exhibits long upper shadows or bearish engulfing patterns. At the same time, if the 15-minute MACD bars remain negative and the DIF crosses below the DEA, a small position can be opened for shorting.
Stop loss: Set above 64250, which is the confirmation level after breaking the EMA55.
Target levels: First target 63600, second target 63000.
Risk warning: Expectations for interest rate cuts and geopolitical easing are potential positives that could trigger a rapid rebound, and shorts must have strict stop losses.
Follow the Qinglan Crypto Classroom to seize more trading opportunities together! Welcome to visit the official website www.qinglan.org
📊 Qinglan TPV Trading Strategy Backtest Reference
🕒 Last Backtest Time 07-29 07:00:02
Total Analysis: 3281 Backtest: 2479 Accuracy: 77.8% (1928/2479)
免责声明:本文章仅代表作者个人观点,不代表本平台的立场和观点。本文章仅供信息分享,不构成对任何人的任何投资建议。用户与作者之间的任何争议,与本平台无关。如网页中刊载的文章或图片涉及侵权,请提供相关的权利证明和身份证明发送邮件到support@aicoin.com,本平台相关工作人员将会进行核查。


