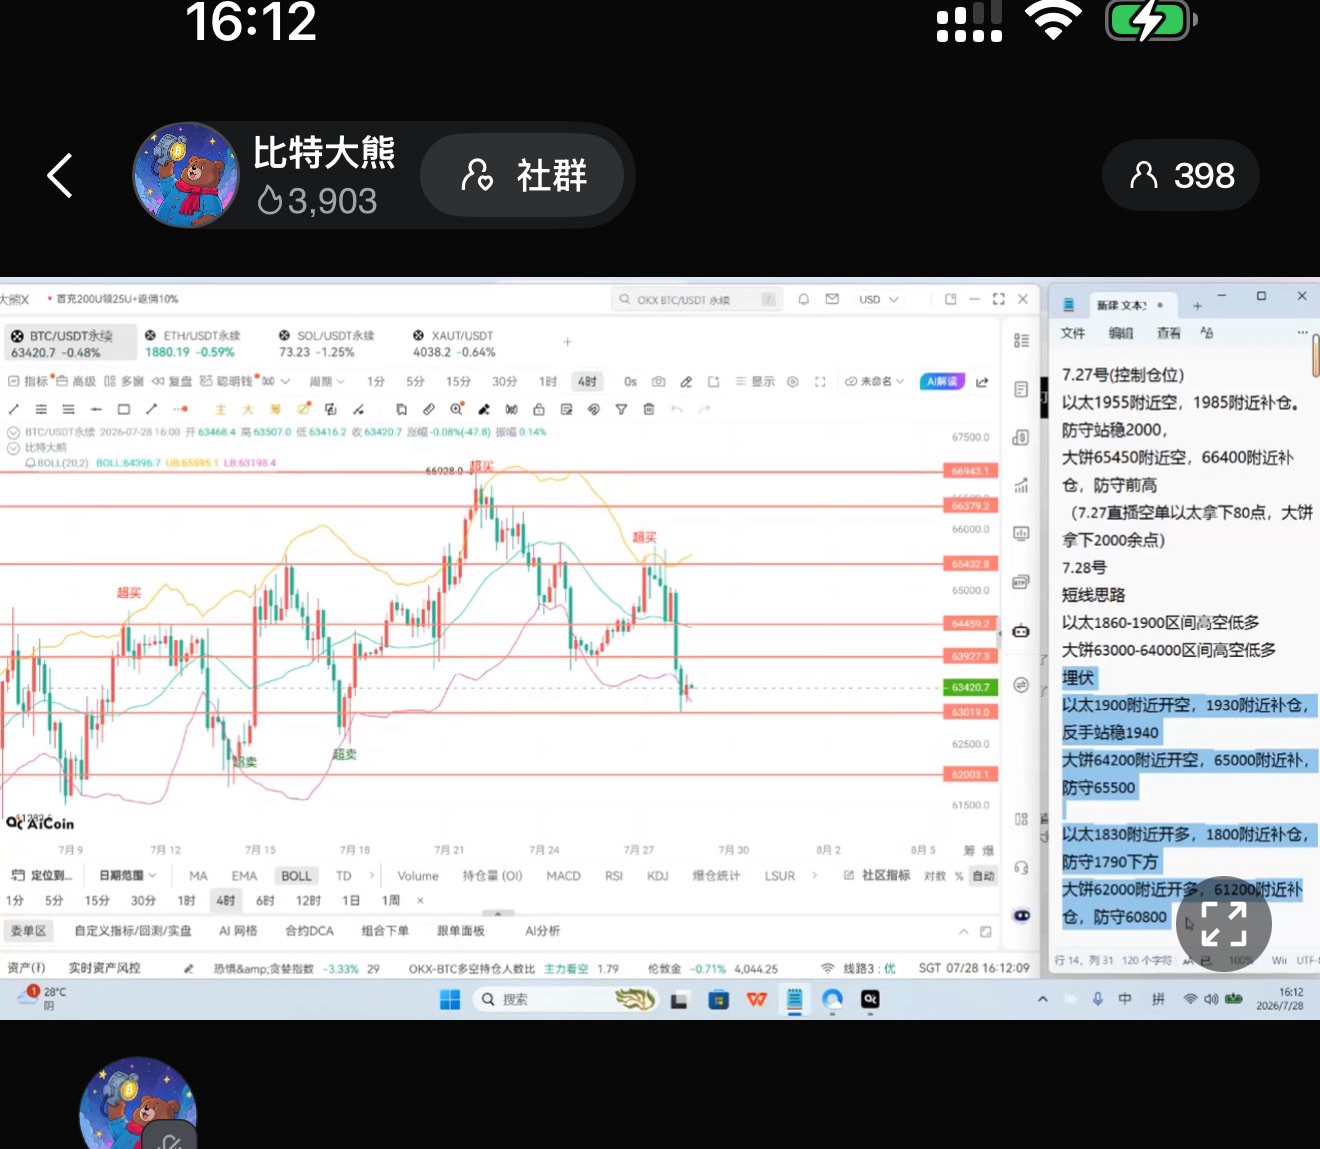
Yesterday in the live broadcast, the short-term strategy suggested that Ethereum could oscillate between the high shorts and low longs in the range of 1860-1900, allowing for two to three waves of trading. After the broadcast ended, a short position was opened at 1900, then adding to the position near 1930, with an average price of 1915 after gradually building the position. Finally, it dropped to 1880, allowing one to gain over thirty points. The trading idea for Bitcoin recommended trading back and forth in the range of 63000-64000, especially the short position given near 64200, which is the best entry point. Ultimately, one could profit six to seven hundred points. The strategy and market trend are updated in real-time every day.
BTC Bitcoin 1-Hour Bollinger Bands + K-Line Market Analysis
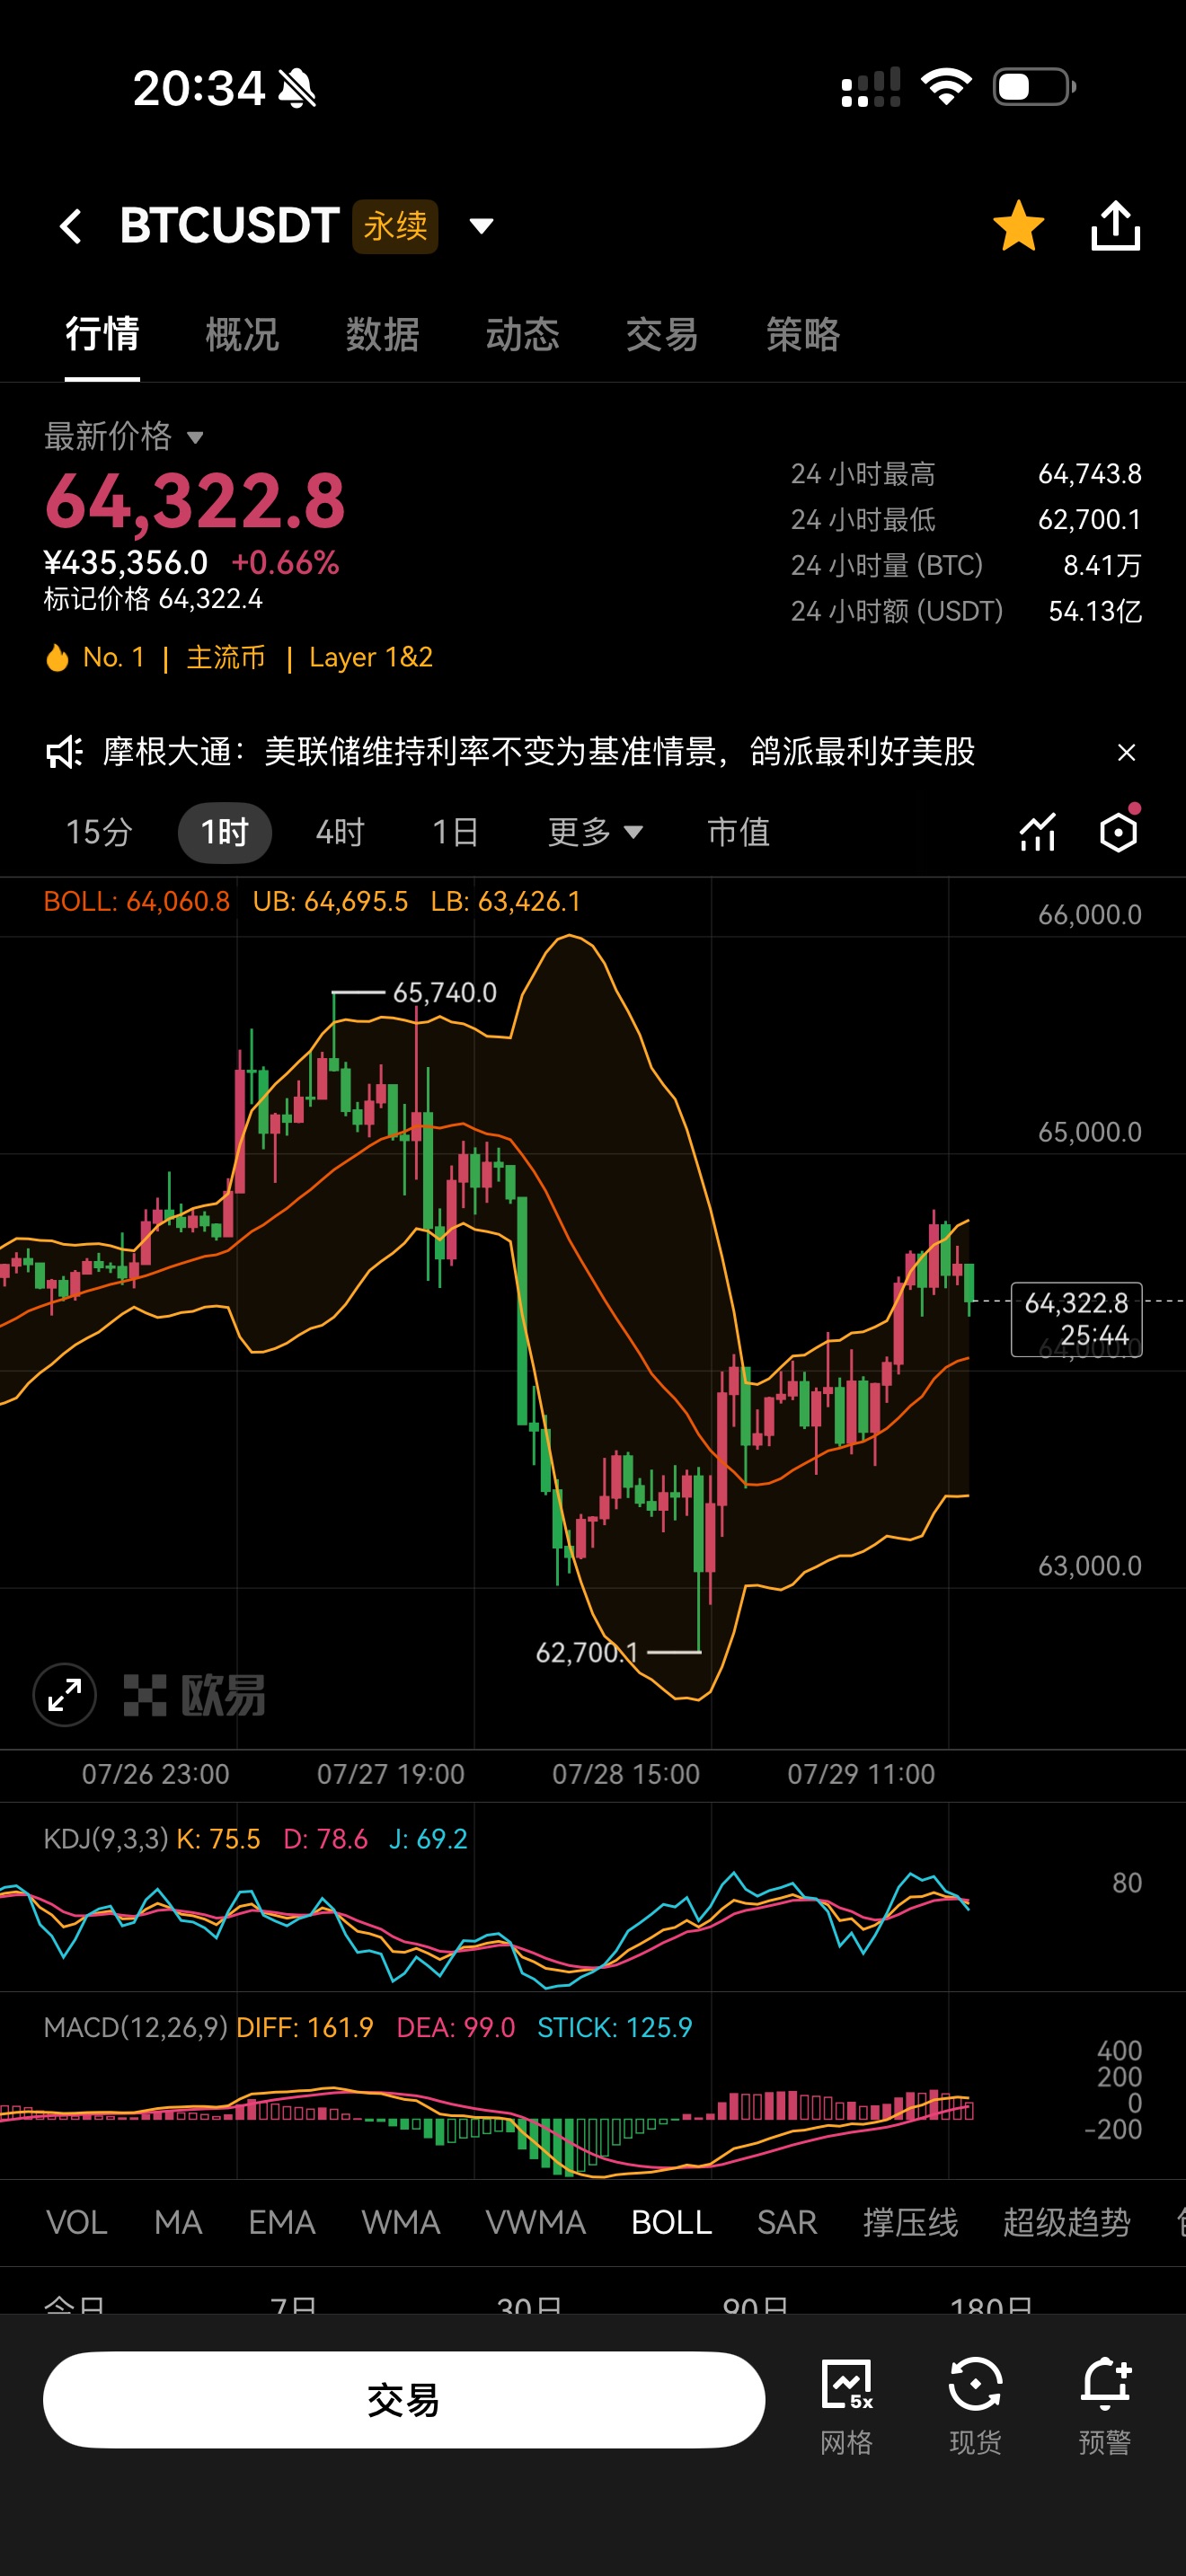
Let's first summarize the rhythm of this round: Initially, the price surged to 65740, touching the upper band of the Bollinger Bands, which led to a depletion of bullish momentum, and K-lines continuously closed bearish, falling in pressure. The market continuously descended to test the low point of 62700, accurately retesting the support at the lower band of the Bollinger Bands. After the bearish power was fully released, a round of continuous rebound correction began.
Currently, the price is at 64322, operating above the **middle band** of the Bollinger Bands. Reviewing the volatility-running law of Bollinger Bands: If the price remains above the middle band, it indicates that the short-term market is in a relatively strong pattern; once it effectively falls below the middle band, the market will shift into a weak operating range.
First, let's delineate the key zones:
Short-term upper strong resistance: Bollinger Bands upper band at 65000, which is a vital threshold for this round of rebound. If the price continues to probe upwards and reaches the upper band, pressure could cause a pullback, which is a classic “upper band meets resistance and retraces” pattern.
The first support below is 63000, which is the dividing line between bulls and bears in the short term; further core support is at 62000.
From the K-line structure: After the rebound began from the low point of 62700, the focus of the K-line continued to shift upwards, with the price stable and reliant on the middle band moving up during the rebound phase. However, currently, the price is near the pressure at the upper band, and the pace of the rise has begun to slow; K-line bodies are gradually narrowing, indicating a decrease in bullish attack strength, making it challenging in the short term to strongly break through the upper band for a significant rise. There is a higher probability it will enter a range of oscillation.
1. High short strategy
When the price rebounds near the Bollinger upper band at 64800, and K-line shows signs of stagnation and turning bearish, short positions can be arranged; stop loss set above the recent high at 65500, with the first target looking toward the middle band near 63500, and the second target below at around 63000 support.
2. Short-term low long strategy
If the market retraces to test support near 63000, and K-line stops falling and closes a stabilization bullish line, one can lightly position for a short-term rebound; targets are set towards the pressure near 64000 to exit. Note that if 63000 support is effectively broken, the strong structure will be disrupted, and the low long strategy should be paused.
3. Breakout response plan
✅ Upward breakthrough: If the price sustains above the Bollinger upper band at 64800, it represents renewed bullish strength, opening the oscillation pattern upward. Abandon the high short strategy and wait for a retracement to follow up with long positions;
✅ Downward breakout: If the price's body breaks below the Bollinger middle band at 63000 and continues to operate below the middle band, the market will turn from strong to weak, testing the support at 62000 again; avoid blind bottom fishing.
BTC's current 1-hour cyclical is in a strong oscillating market after rebounding from the lower band, and the middle band serves as effective support, while the upper band above poses strong resistance. Short-term trading is mainly suited for buying low and selling high within the range, focusing on the gains and losses at key support and resistance levels, waiting for clear signals from the K-lines in conjunction with the Bollinger bands before entering trades and avoiding chasing or panic selling.
ETH Ethereum 1-Hour Bollinger Bands + K-Line Market Analysis
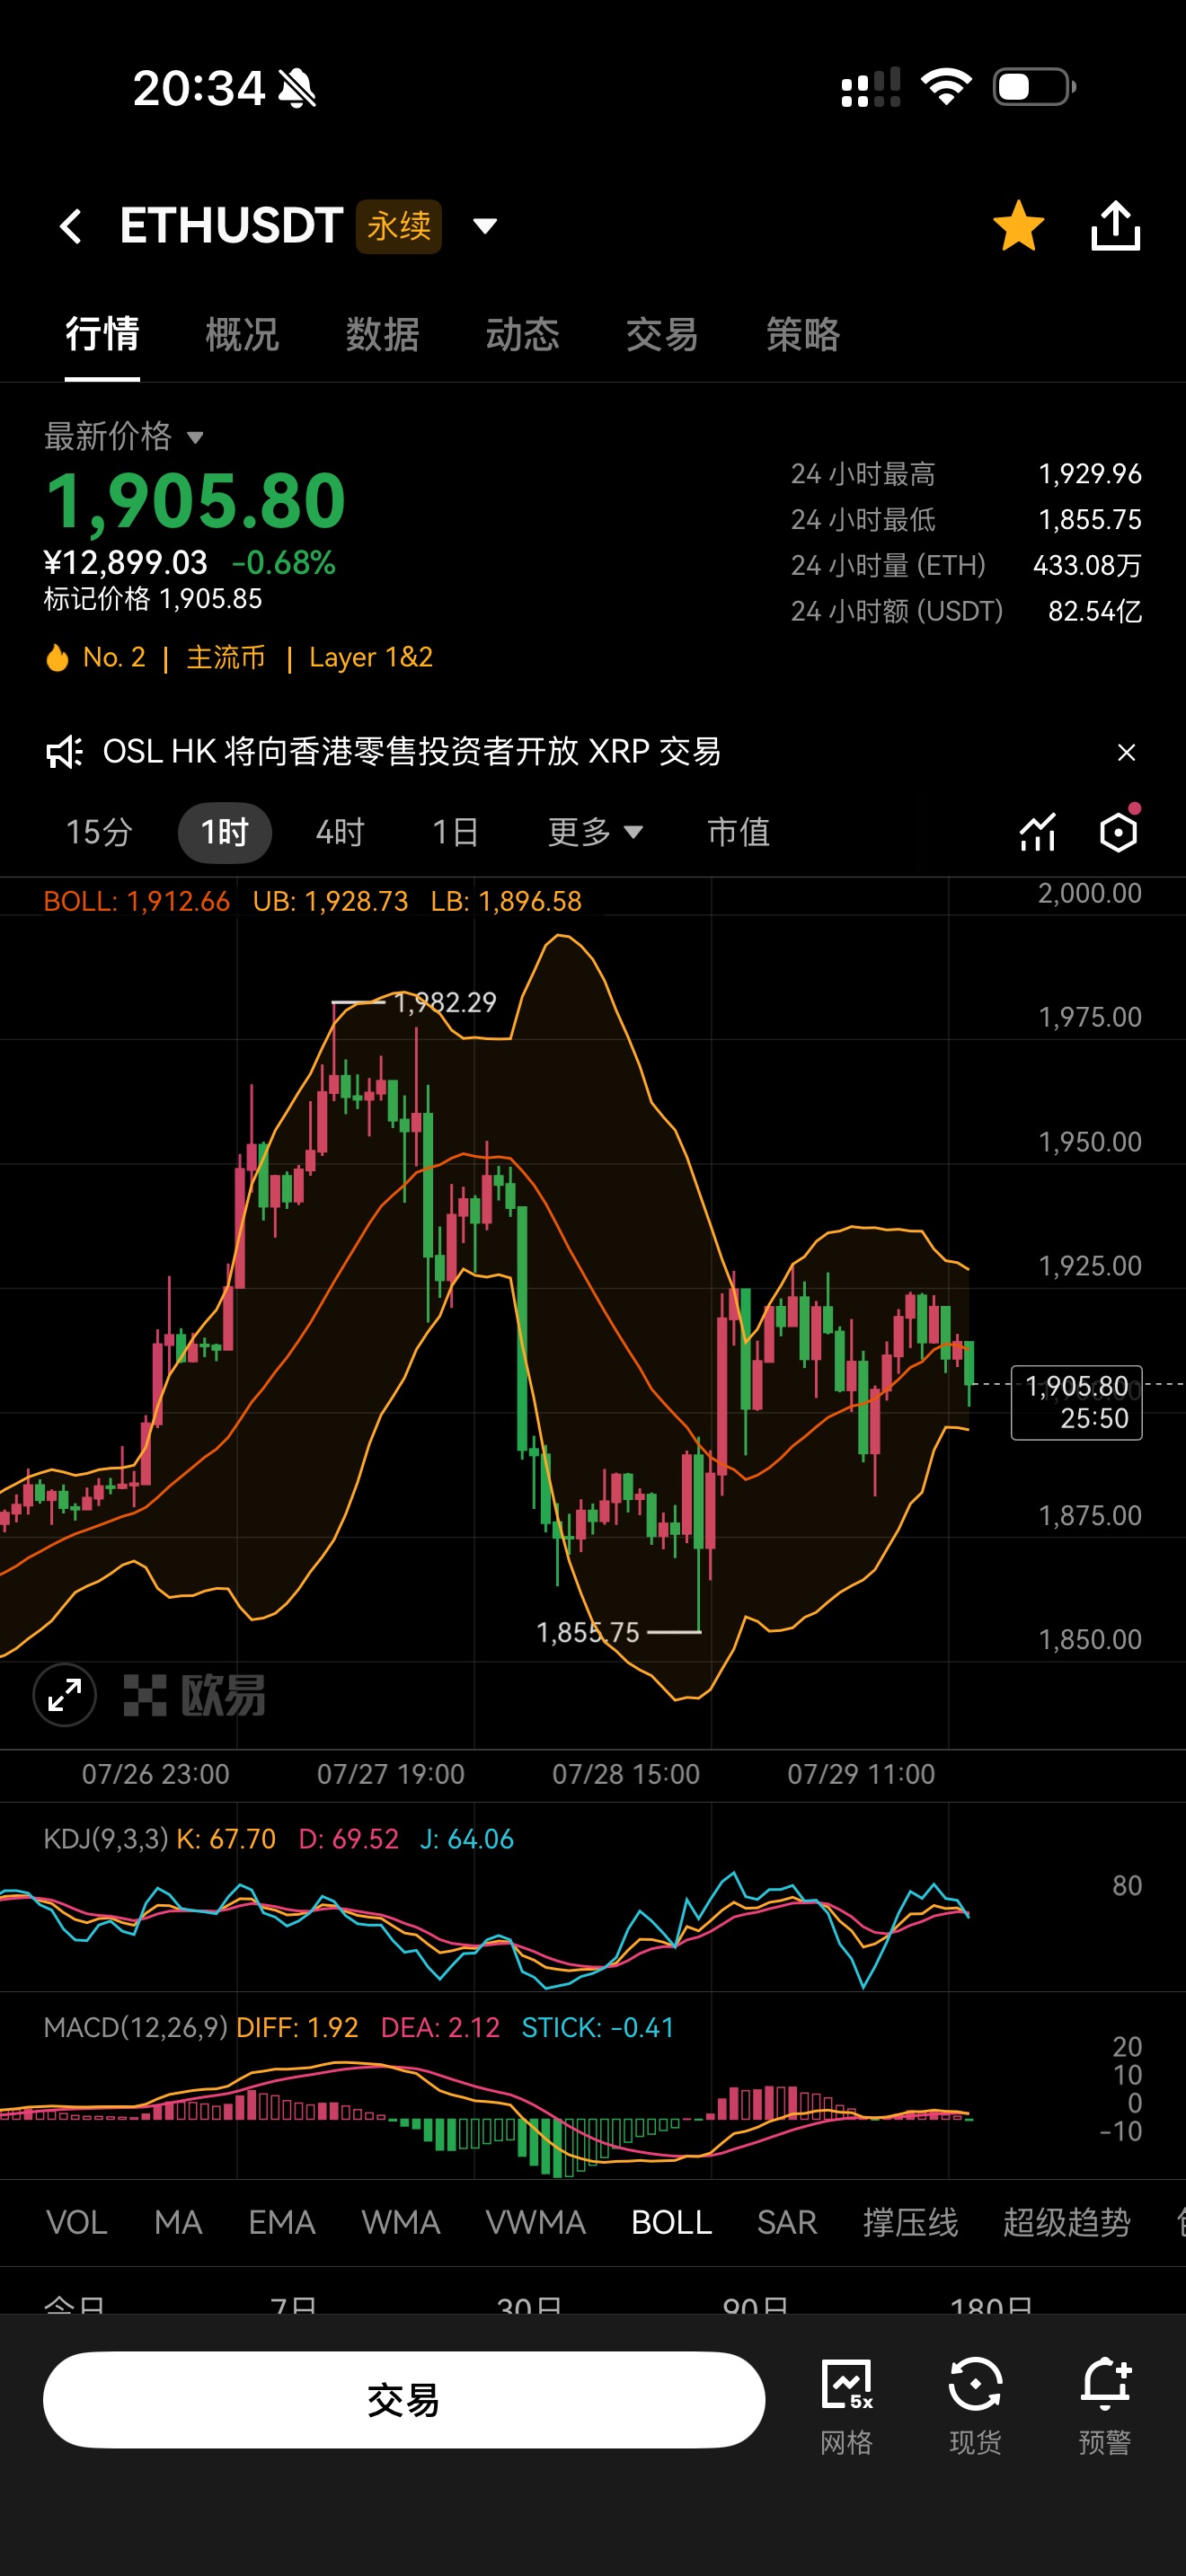
Let's first summarize the overall operational rhythm: The market initially surged to a high of 1982, where the price touched the upper band of the Bollinger Bands, leading to exhaustion of bullish momentum. K-lines continuously closed bearish, commencing a deep pullback that dipped to 1855, accurately retracing to the lower band support of the Bollinger Bands. After the bearish powers were fully released, a round of rebound correction manifested.
Currently, the price is at 1905, which has fallen below the middle band of 1912. In conjunction with the trading logic of the Bollinger Bands: The middle band acts as a demarcation line for short-term bullish and bearish strength. If the price holds above the middle band, it is in a relatively strong oscillation pattern; however, continually operating below the middle band indicates the market has officially transitioned into a weak range.
We delineate the core key zones:
Short-term upper pressure zone: Bollinger upper band at 1930, with further strong pressure at 1950;
First primary support below: 1860, if this level fails to hold, further downside space will open up.
Observing the K-line formation: After the rebound initiated from near the low of 1855, the price once approached the upper band of the Bollinger Bands. Still, the bulls could not maintain momentum to break through the upper band pressure, subsequently, K-lines gradually turned bearish and the price slowly fell below the middle band of the Bollinger Bands. Currently, the rebound phase has reached a temporary halt, with bears starting to regain short-term control. In the short term, the probability of a direct strong surge is low, and the market will likely maintain a downward oscillation rhythm.
1. Rebound high short strategy
If the price rebounds to test the middle band between 1920-1930, and the K-line shows signs of stagnation and turning bearish, one can arrange a short position; stop loss set above 1950, with the first target looking towards the 1870-1890 area, following which a further drop can be expected.
2. Short-term low long strategy (only short-term rebound speculation)
If the market directly retraces to the support range of 1870-1890, and the K-line closes a stabilization bullish formation, one can lightly position to speculate on rebounds; targets should look to exit near the middle band pressure of around 1910. It is crucial to note that if it breaks below support at 1860, do not attempt to bottom fish any longer.
3. Key breakout response
✅ Upward breakthrough: If the price re-establishes itself around the middle band at 1910 and continuously breaks above the pressure point of 1950, the weak pattern will reverse. Pause the high short strategy and wait for a retracement to follow up with long positions;
✅ Downward breakout: If the price's body effectively drops below the lower band of 1860, oscillating support will be invalidated, opening downside space, and follow the bearish strategy, avoiding counter-trend bottom fishing.
Overall summary: The ETH one-hour cycle indicates that the upper band has peaked and the rebound has ended, with the current price facing pressure below the middle band. The short-term trend is weak. Trading strategy should prioritize high shorts in line with the resistance at the middle band, while low long positions should be quick in and out. Strictly monitor the strength of the support below 1860 and pressure above 1930, waiting for the K-lines in conjunction with the Bollinger bands to provide clear signals before participating in trading, avoiding blind chasing orders.
WeChat Official Account - Bitcoin Bear X
(Note: 📣 Due to the limited timeliness and depth of information on public platforms, the market changes rapidly. Critical turning points, precise operational strategies, and sudden risk warnings must be synchronized on the official account immediately. Here you can obtain: Real-time strategy updates, in-depth analysis support, interactive Q&A, and risk warnings and optimization suggestions tailored to individual holdings. 🚨 Remember: The market always rewards those who act faster and with more accurate information! Be among the winners of the minority.)

免责声明:本文章仅代表作者个人观点,不代表本平台的立场和观点。本文章仅供信息分享,不构成对任何人的任何投资建议。用户与作者之间的任何争议,与本平台无关。如网页中刊载的文章或图片涉及侵权,请提供相关的权利证明和身份证明发送邮件到support@aicoin.com,本平台相关工作人员将会进行核查。


