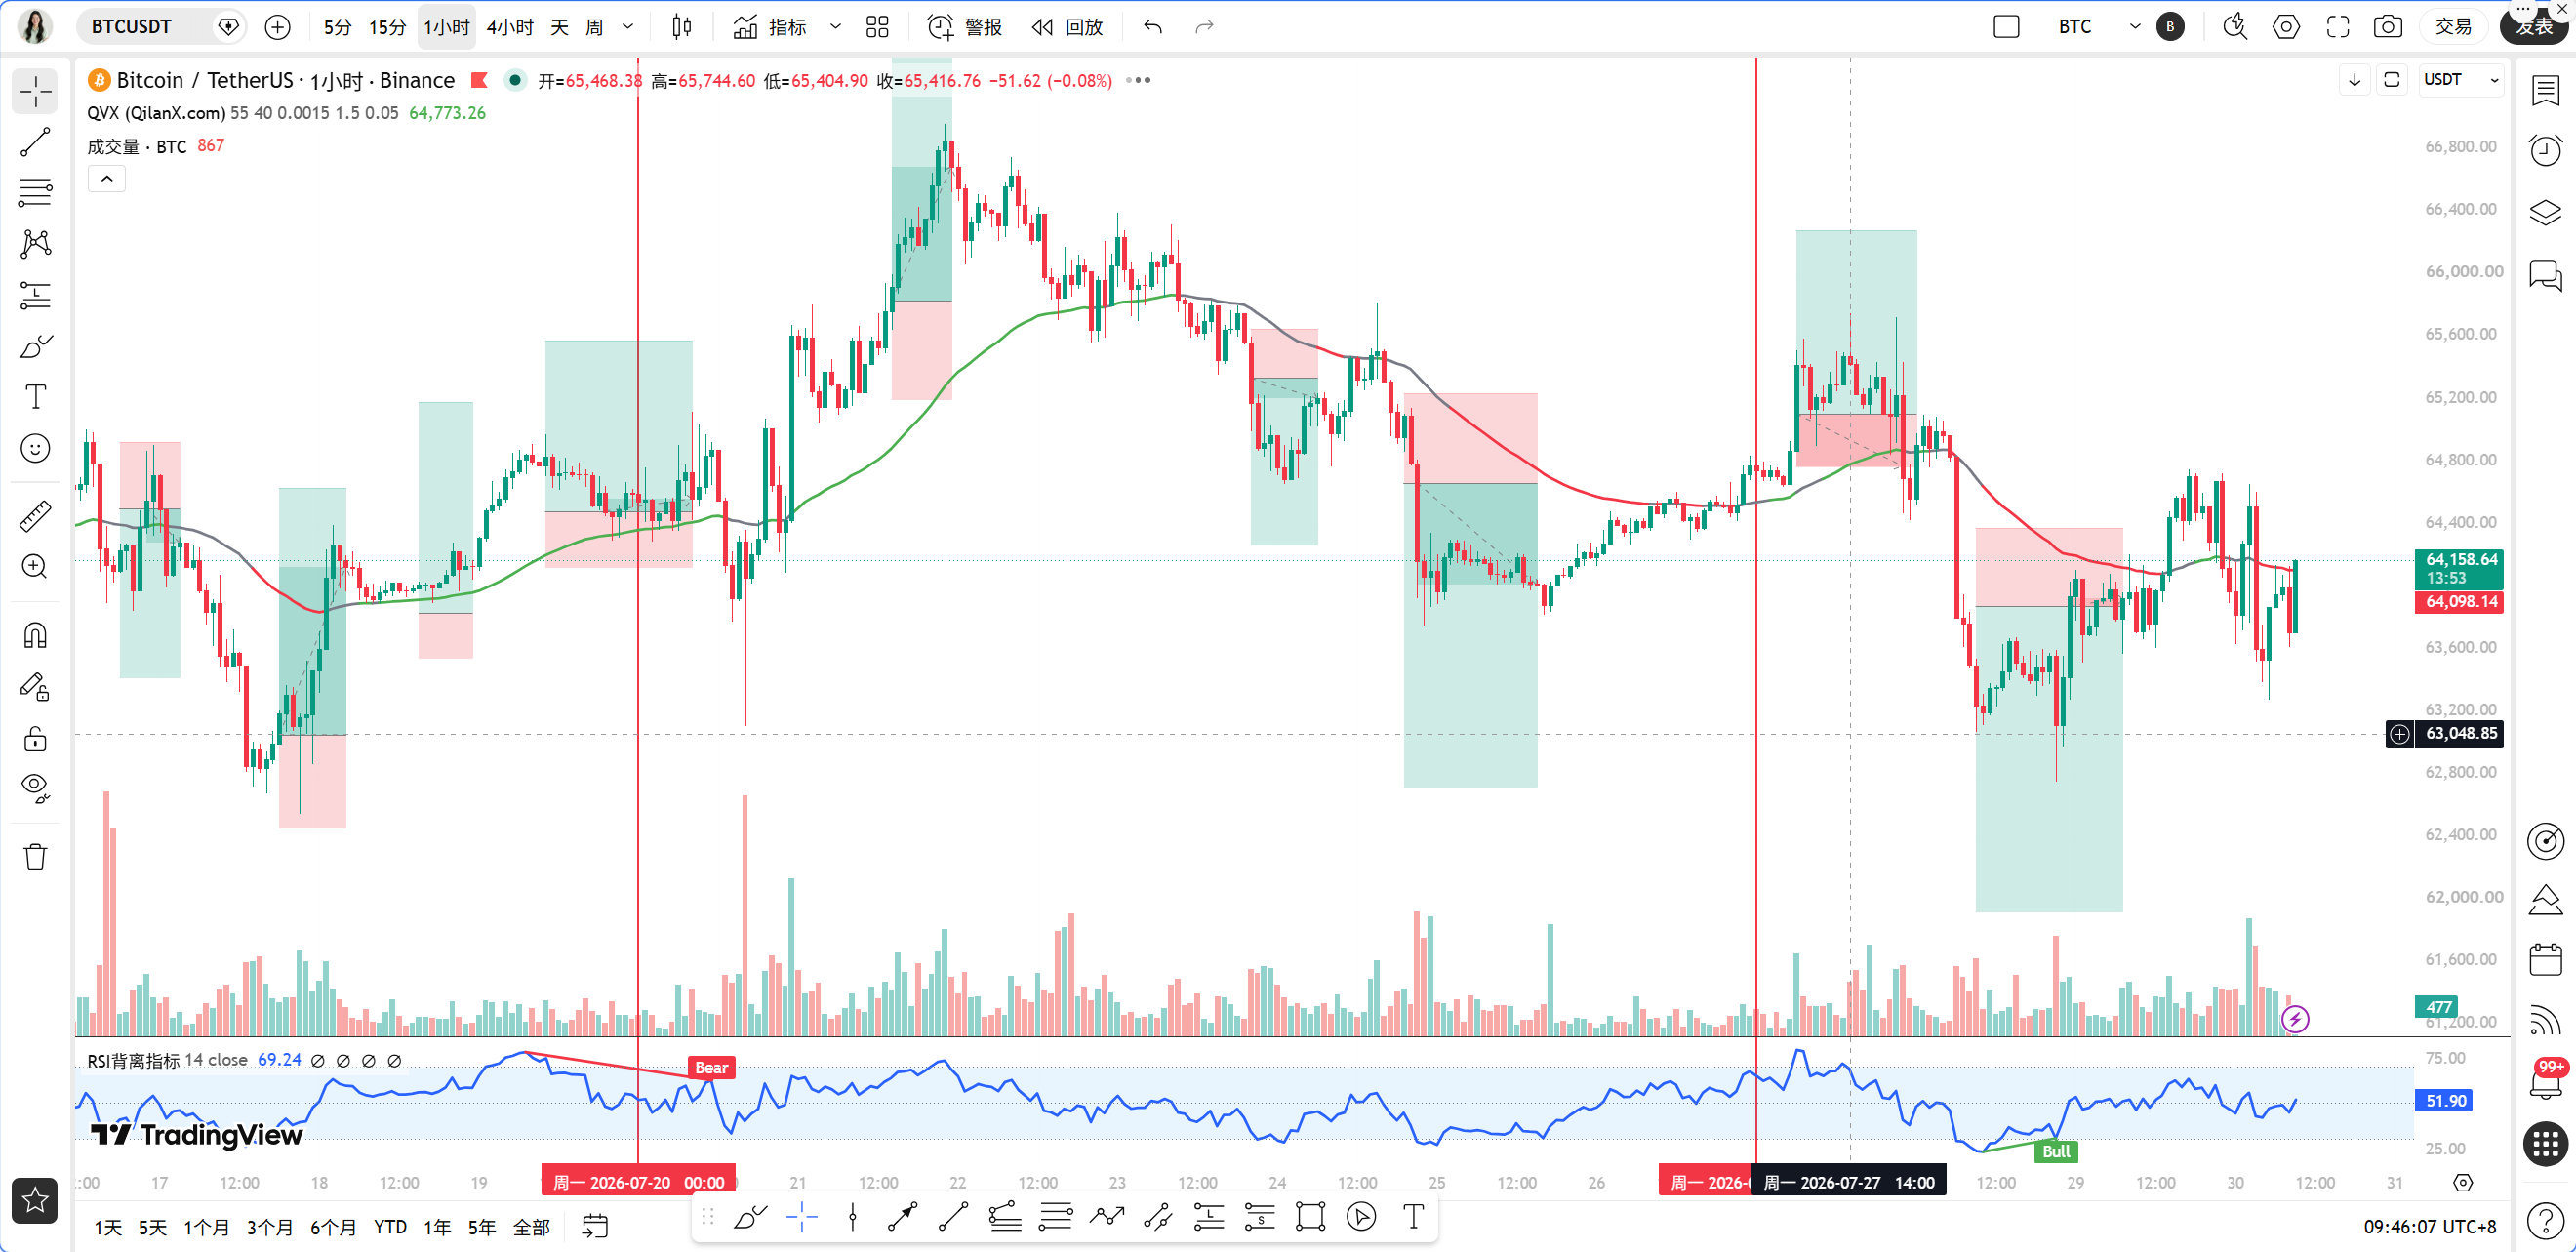
Dear teammates, I am Sister Qinglan. In today's early trading session, the market has been influenced by two significant pieces of news. On one hand, the US military's raid on Iran has sharply increased geopolitical risks, suppressing risk assets and putting significant pressure on BTC; on the other hand, tech stocks are experiencing record sell-offs, with funds rapidly taking profits, which may further affect the cryptocurrency market. These two negative factors combined have led to BTC wavering around $64,200, with increasing divergence between bulls and bears. In today's article, Sister Qinglan will use data to help you understand the current situation and find the most prudent trading strategy.
The current time is July 30, 09:46, and BTC is quoted at 64,200 USDT. Let's start by looking at the multi-timeframe status to quickly locate market rhythm.
On the daily chart, the price is struggling between MA5 and MA30, the MACD DIF line has crossed below the zero axis, and the histogram continues to shorten, indicating a depletion of bullish momentum. RSI is around 52, which is in a neutral to weak area. The 4-hour chart has shown some positive signals, the MACD histogram has turned from negative to positive, and the DIF line is starting to turn upwards, suggesting a preliminary form of bottom divergence, but the price is still suppressed by MA30, limiting the rebound strength. The 1-hour chart is the core battlefield of today; the price is operating below EMA55, MACD is below the zero axis, and RSI is around 46, with bears holding the initiative. The 15-minute chart indicates a short-term need for a rebound, with MACD showing a golden cross and RSI climbing back to 56, but the strength is not strong, indicating a technical correction after overselling.
Overall, the larger timeframe leans bearish while the smaller timeframe shows a demand for a rebound. The market is in a phase of oscillation and bottoming out, and directional choices are imminent.
Next, we will use the Qinglan TPV system to verify the signals. The core rule is that the 1-hour EMA55 serves as the dividing line between bulls and bears, with the current EMA55 at $64,110. Among the last 8 hourly candlesticks, there have only been 2 instances where the closing price was above EMA55, and it has crossed it 2 times, with the price’s absolute range from EMA55 being 0.14%, indicating a near-line fluctuation, which increases the probability of oscillation. According to system rules, it currently does not meet the threshold for a unilateral trend, nor does it satisfy the strict definition of an oscillating market, placing it in a gray area.
Specifically, looking at the short-selling conditions. First, the price is pressured below the 1-hour EMA55; the last two candlestick closing prices were 64,150 and 64,200, both below EMA55's 64,110, satisfying the condition. Second, there is a resistance formation; a long upper shadow appeared around 64,300 on the hourly chart, showing heavy selling pressure above. Third, the rebound lacks strength; although the MACD histogram is shortening, the DIF and DEA remain below the zero axis, and the RSI has slightly rebounded from 46, without adequate strength. The conditions for short-selling are mainly met but caution is required due to the rebound risk from the 4-hour bottom divergence.
Regarding the conditions for going long, the price has not yet stabilized above EMA55, the supporting stabilization form is not clear, and while there are signs of depletion in downward momentum, there is no clear bullish engulfing or bottom divergence formation. Therefore, the conditions for going long are not met, and it is not advisable to actively catch the bottom at this time.
On-chain data shows that the fear and greed index has fallen to 28, in the fear zone, indicating extremely pessimistic market sentiment, which is often a characteristic of a temporary bottom. The BTC market share remains at 56.44%, indicating that funds are still seeking safety in BTC and have not significantly flowed into altcoins. In terms of liquidity, the tech stock sell-off and geopolitical risks have intensified risk-averse sentiment, with gold breaking through $4,100, but BTC has not risen in sync, indicating that the cryptocurrency market is still under pressure from tightening liquidity.
The key defensive and offensive positions are: the first resistance position above is the 1-hour EMA55 at $64,110, and the second resistance position is the 4-hour MA30 at $64,293, breaking through here will open up a rebound space. The first support position below is $63,800, which is a dense trading area on the 15-minute chart; the second support position is $63,500, a break below this will accelerate the decline.
In terms of trading strategy, Sister Qinglan provides the following strategy. The direction is primarily focused on short, but confirmation of a rebound is needed. Entry conditions: if the price rebounds to the $64,100 to $64,200 range and a 15-minute level long upper shadow or top divergence appears, a light short position can be attempted. Set the stop-loss above $64,400, with target levels at $63,800 and $63,500. If the price directly breaks below $63,800, a short can be pursued in the direction of the trend, with stop-loss set at $64,000, and targets set at $63,500 and $63,200. Going long requires waiting for the price to stabilize above the 1-hour EMA55 and a clear bottom divergence or bullish engulfing signal to appear, otherwise, do not participate.
Risk reminder: Current market volatility has increased, geopolitical events and macro data may trigger severe fluctuations at any time, please strictly control positions, operate with light positions, and ensure risk control.
Follow Qinglan's crypto classroom to seize more trading opportunities! Welcome to visit the official website www.qinglan.org
📊 Qinglan TPV Trading Strategy Backtest Reference
🕒 Last Backtest Time 07-30 07:00:01
Total Analysis: 3303 Backtest: 2496 Accuracy Rate: 77.9% (1945/2496)
免责声明:本文章仅代表作者个人观点,不代表本平台的立场和观点。本文章仅供信息分享,不构成对任何人的任何投资建议。用户与作者之间的任何争议,与本平台无关。如网页中刊载的文章或图片涉及侵权,请提供相关的权利证明和身份证明发送邮件到support@aicoin.com,本平台相关工作人员将会进行核查。


