Author: Alea Research
Translator: Shenchao TechFlow
Shenchao Guide: Last week, almost all earnings reports confirmed that the demand for AI computing power is real, yet major tech stocks fell instead. The market is re-pricing according to a new standard: Who will fill the funding gap for AI infrastructure—company's own cash flow, customer advance payments, or borrowed money? This determines which companies can hold out until the day AI becomes monetized.
Growth Companies Were Sold Off, Where is the Funding Gap, Who Pays for AI Infrastructure
Most companies that reported earnings last week saw revenue growth, but their stock prices still fell. S&P 500 fell by 0.6%, Nasdaq dropped by 2.1%, and almost every earnings report confirmed that the demand for AI computing power is real.
Building AI capacity means paying for chips, data centers, memory, and power several years in advance, with revenue coming much later. The market spent a week classifying companies: seeing who will fill this gap—company's own cash, customers' money, or borrowed money.
This article is part of this week's Pulse report regarding stocks.
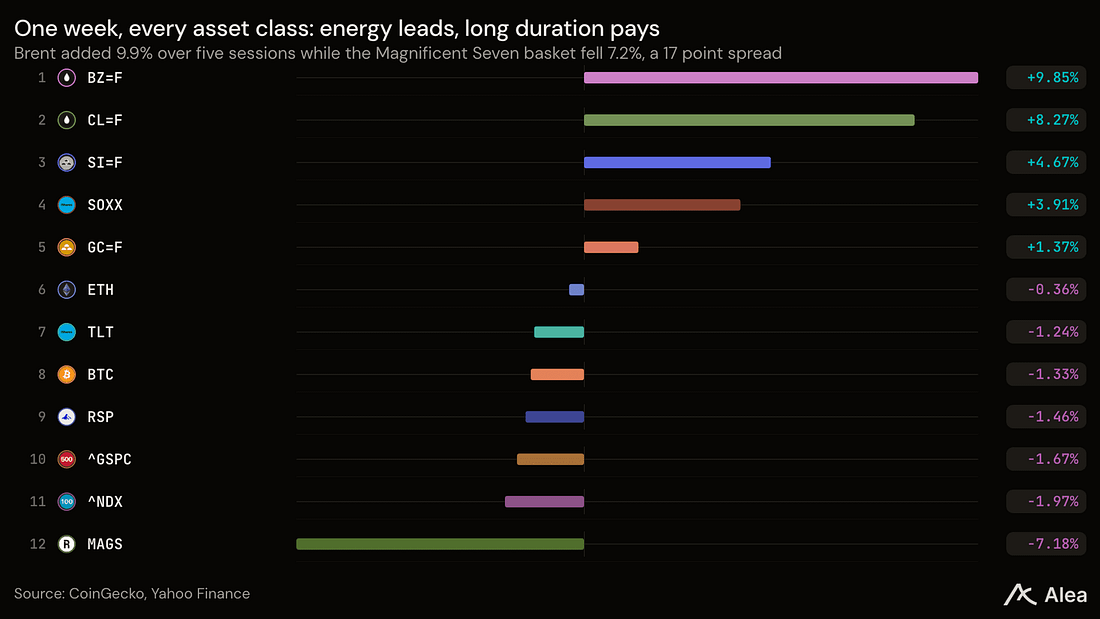
Chart: Performance of Various Asset Classes for the Week: Energy Leads, Long-Duration Assets Under Pressure
Source: Alea Research / Substack
Why Good News Still Declines
SPY, a market-cap weighted S&P 500, is led by a few giant tech stocks, rising 0.1% for the week. RSP holds the same 500 stocks but with equal weight, rising 0.8%. QQQ, which focuses on tech stocks in Nasdaq 100, dropped 1.1%, and the semiconductor basket SOXX fell 4.3%. The broader market was bought into on Friday, with sales specifically targeting major AI concept stocks.
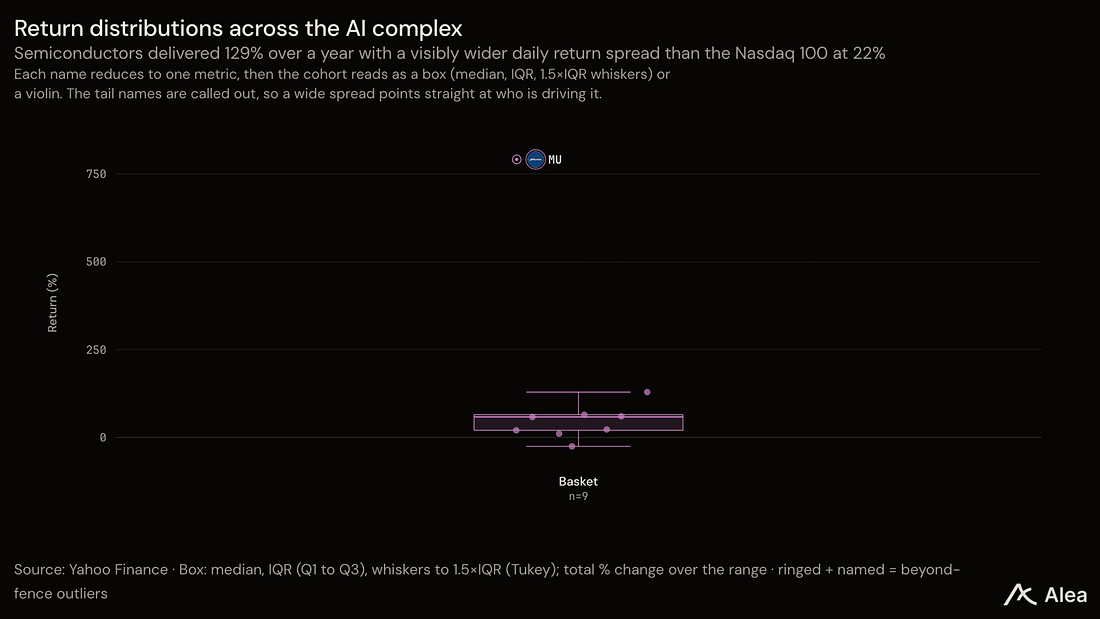
Chart: AI Complex Yield Distribution: Semiconductors Returned 129% Over the Year, Far Higher than Nasdaq 100's 22%
Source: Alea Research / Substack
When it looks more difficult to lower interest rates, these stocks fell hardest, as their prices depend on expected profits years down the line. When interest rates rise, holding bonds—a boring alternative—earns more just by waiting, so every future profit is discounted against that richer alternative. Investors are not exiting the market—if they were, equally weighted baskets would also fall. They are shedding stocks whose value sits furthest in the future, just as that future becomes more expensive.
Funding Gap
A company generates cash from operations, while also spending cash on capital expenditures—chips, buildings, and grid access required for infrastructure. When capital expenditures exceed operational cash flow, the shortfall needs to come from somewhere—either new debt, new equity, or the company's reserves.
All three have become more expensive last week. The cost of debt is directly linked to interest rates. The cost of equity financing is higher because rising interest rates bring down stock prices, forcing the company to sell more shares to raise the same amount of money. Spending reserves means giving up the interest those reserves could earn now, and interest rises with interest rates.
Interest rates face two major upward pressures. First, attacks on tankers have disrupted transport in critical shipping lanes, driving Brent crude oil over $100 a barrel, raising baseline inflation expectations. Second, import prices rose 7.1% year-over-year, driven by rising costs of computers, semiconductors, and industrial machinery. This hardware is exactly what drives the expansion of AI infrastructure. These pressures limit the Federal Reserve's ability to loosen monetary policy; futures pricing shows a 75% probability of maintaining the current rate and a 25% probability of a rate hike.
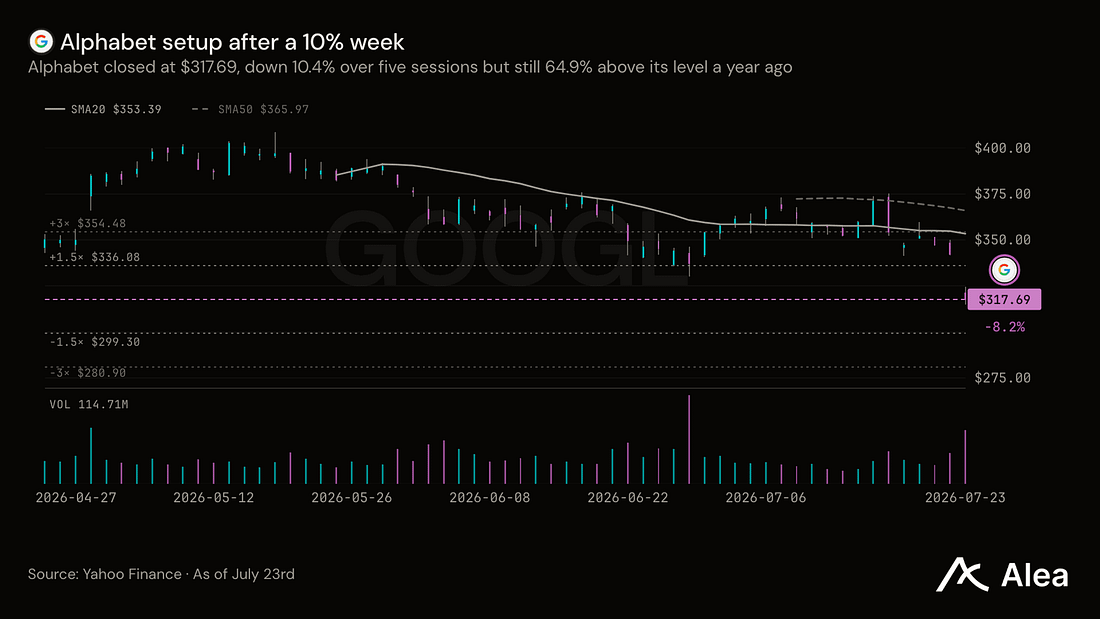
Chart: The Technical Form of Alphabet After a 10% Drop in a Single Week
Source: Alea Research / Substack
Alphabet had strong performance across all businesses this quarter: Cloud revenue grew 82% to $24.8 billion, cloud profit margin expanded from 20.7% to 35.6%, and search still grew by 17%. However, the stock fell 7.2% after the earnings report because Alphabet spent $44.9 billion on capital expenditures, while operational cash flow was only $39.1 billion, resulting in a quarterly gap of $5.9 billion, and then told investors to expect capital expenditures of $195-205 billion by 2026. No one questions demand, so the re-pricing centers around how that spending will be financed.
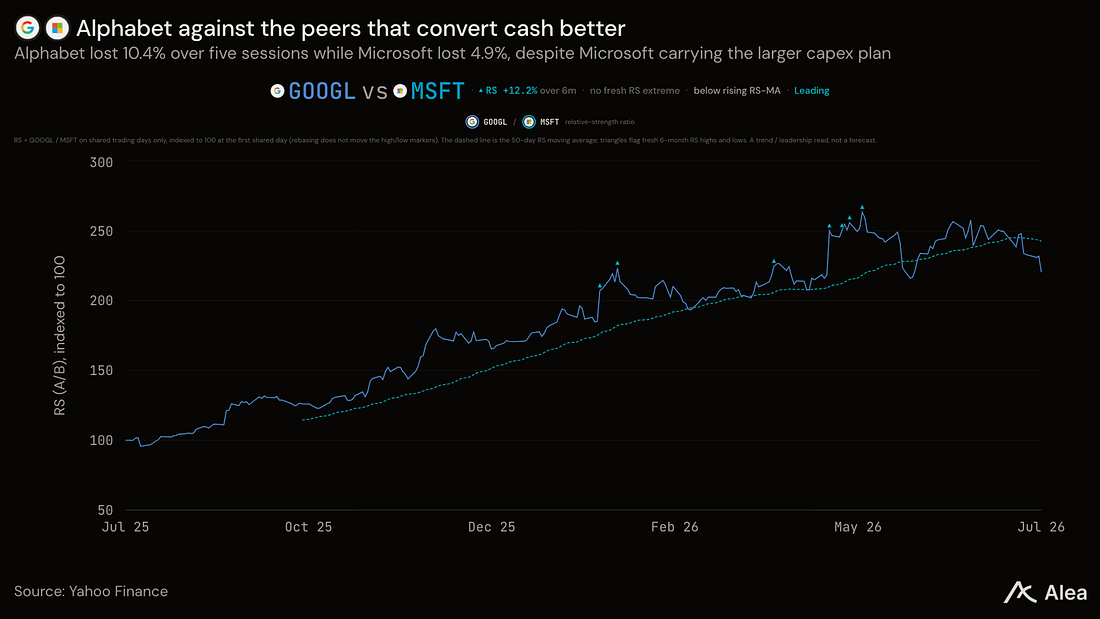
Chart: Comparison of Alphabet with Microsoft, which has Stronger Cash Conversion Capability
Source: Alea Research / Substack
Oracle reported an annual funding deficit, with capital expenditures of $55.7 billion against $32 billion operational cash flow (a gap of $23.7 billion), and a financing plan requiring approximately $40 billion of debt and equity issuance combined. Despite winning a contract with the Pentagon worth up to $7 billion, the stock reached a 52-week low because it had to spend money to build data centers before revenue came in.
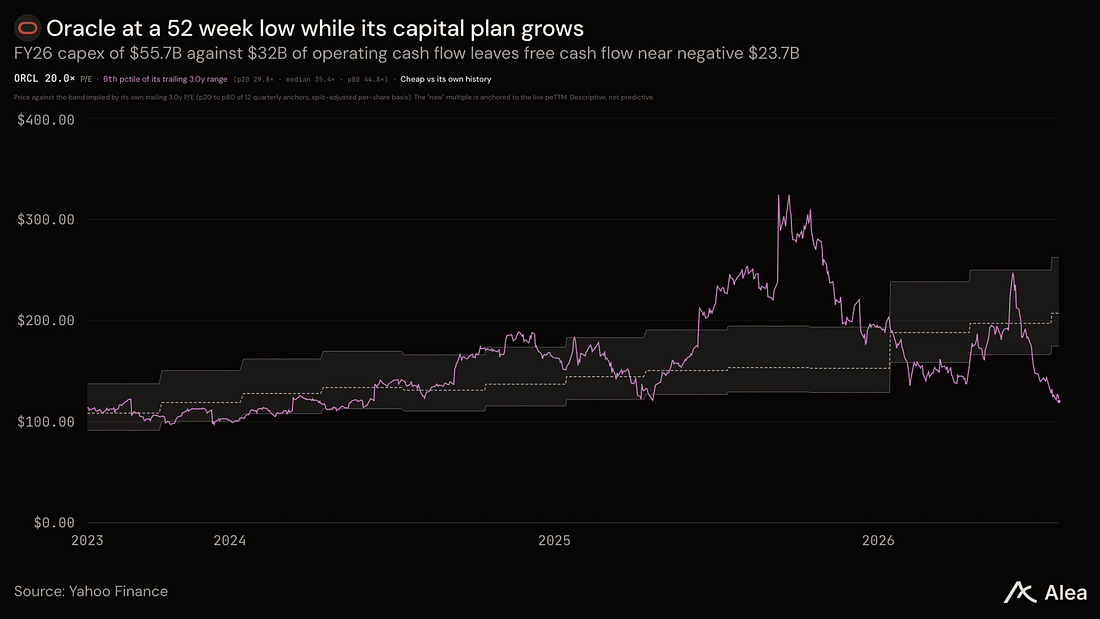
Chart: Oracle's Stock Price Hits 52-Week Low While Capital Expenditure Plans Continue to Expand
Source: Alea Research / Substack
Tesla delivered a record 480,126 vehicles, but operating profit margin compressed to 1.4%. Operating cash wasn't enough to cover $5.8 billion in quarterly infrastructure spending, resulting in negative free cash flow of $1.1 billion.
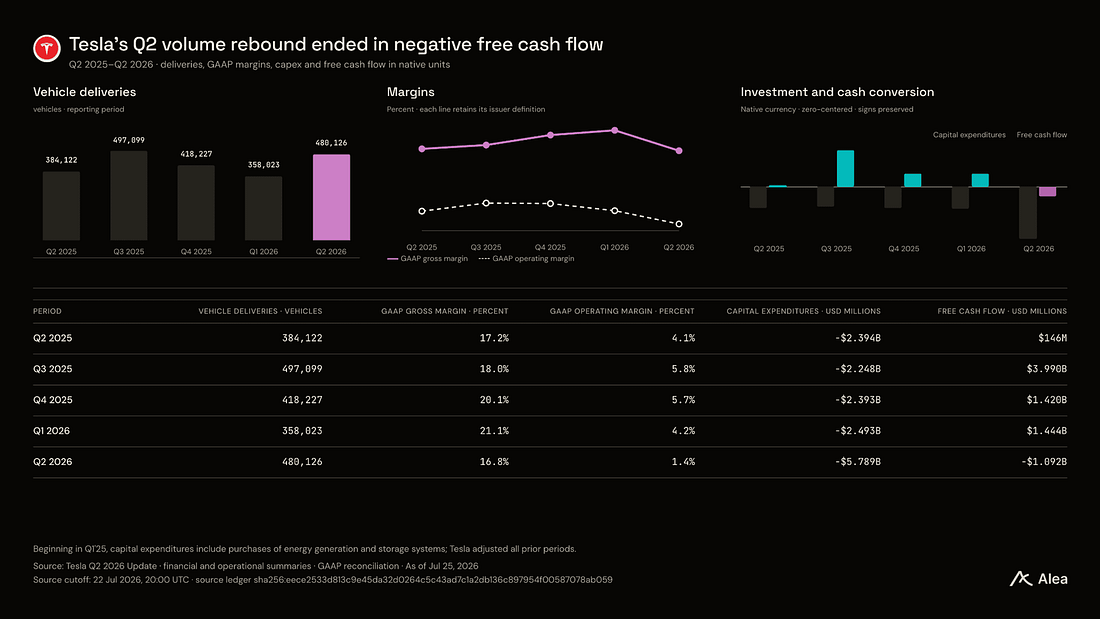
Chart: Tesla's Q2 Sales Rebound, but Final Free Cash Flow is Negative
Source: Alea Research / Substack
Companies with Customer Advance Payments
Companies that have preserved their market value have customers or counterparties committing to absorb part of the infrastructure costs through contracts. First, customer deposits are cash given now for future supply, financing factories directly with buyers' money. Second, take-or-pay agreements require customers to pay a minimum amount regardless of whether they take delivery, turning future demand into a legal right that lenders are willing to loan against. Finally, backorders, or piles of orders that are signed but not yet delivered, do not provide funding by themselves but eliminate the risk of needing to charge lenders higher fees.
Micron has 16 long-term take-or-pay agreements, covering about one-fifth of DRAM output until 2030, with approximately $100 billion in minimum contract revenue and $22 billion in customer deposits. Its customers are paying for its factories.
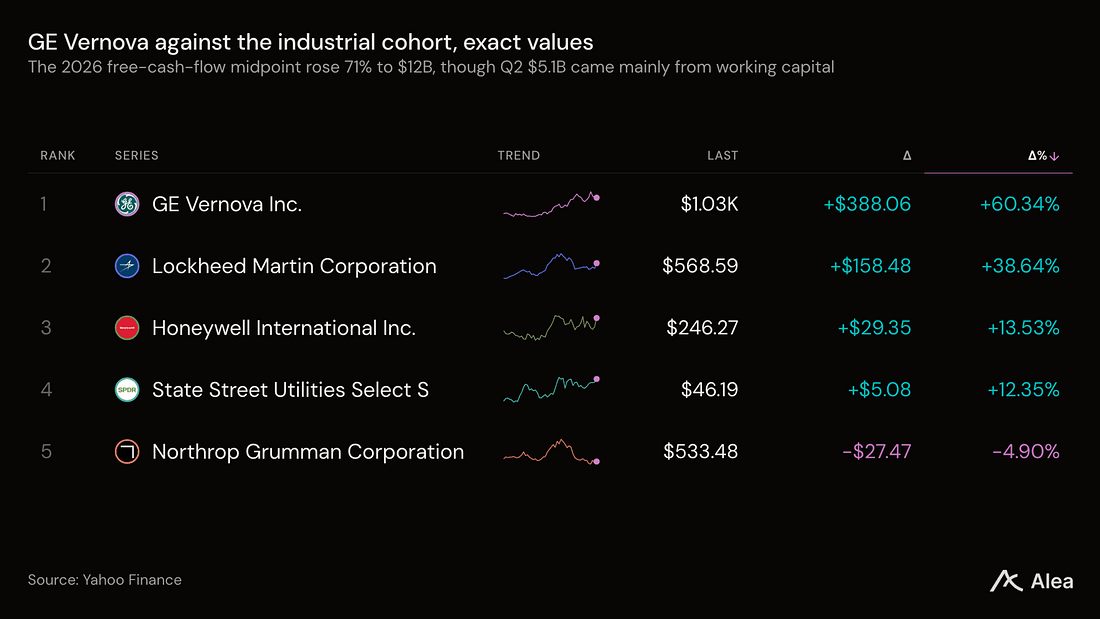
Chart: GE Vernova's Absolute Numbers Compared to Industrial Peers
Source: Alea Research / Substack
GE Vernova sells turbines and grid equipment, translating electricity demand into power, and during a quarter that delivered $11.1 billion in revenue, it booked $24.2 billion in orders, with $176 billion in backlog equivalent to about four years of sold work.
Lockheed's backlog reached $230 billion, about 2.9 years of revenue. Microsoft is a self-funded version on the same escape route: it spent $31.9 billion on capital expenditures, about 68% of the $46.7 billion in operational cash flow, and had $15.8 billion in cash left after infrastructure. It is running on infrastructure similar to Alphabet, but does not need external funding.
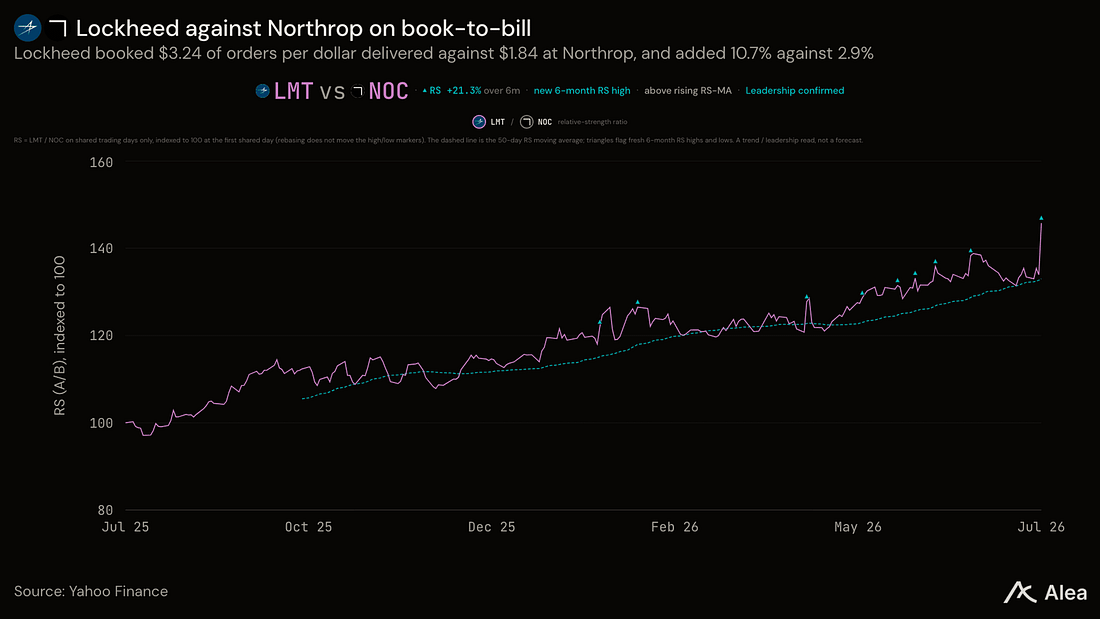
Chart: Comparison of Lockheed and Northrop's Book-to-Bill Ratio
Source: Alea Research / Substack
Two points to note. Pre-sold revenue is not necessarily pre-sold profit. Northrop has booked $1.84 in new orders for every $1 delivered, and profit margins slid from 11.8% to 10.6%, as the speed at which orders arrive may outpace the company's ability to profitably deliver. Moreover, the diversification among these companies appears thinner than their stock code lists suggest: much of the incremental order growth in memory, chips, and power equipment traces back to the budgets of the same few data centers. This is why Micron, despite having contracts, still dropped 6.9% on Friday. The pace of increasing stock codes is outpacing the pace of increasing diversification in holding memory manufacturers, chip baskets, and turbine makers.
Microsoft and Amazon Earnings Reports
Microsoft reports earnings on July 29, and only if Azure grows close to 40%, operational income once again grows faster than revenue, while capital expenditures exceed $40 billion per quarter, can it stay in the self-funded category. The Federal Reserve also announced its interest rate decision on July 29, so volatility is expected.
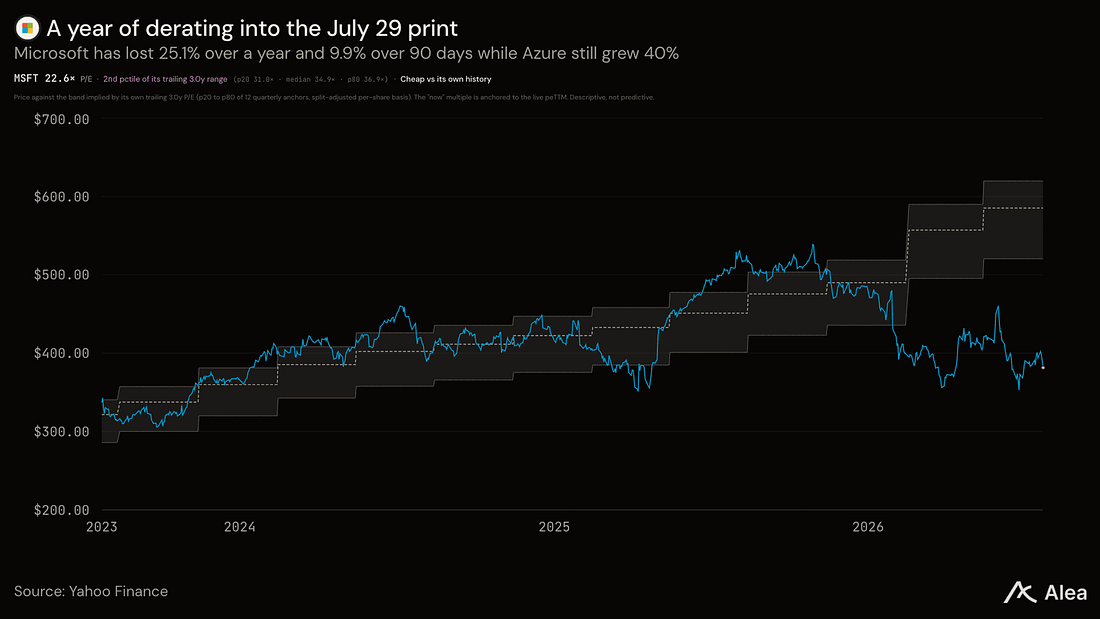
Chart: Microsoft Experienced a Year of Valuation Downgrade Before the Earnings Report on July 29
Source: Alea Research / Substack
Amazon reports earnings on July 30, tracking free cash flow has decreased from $25.9 billion a year ago to $1.2 billion. Its own guidance implies 11.2% operational profit margin, down from 13.1% in the last quarter, and if operational income exceeds $22 billion, it would show that the cloud business is filling cash faster than infrastructure consumes it.
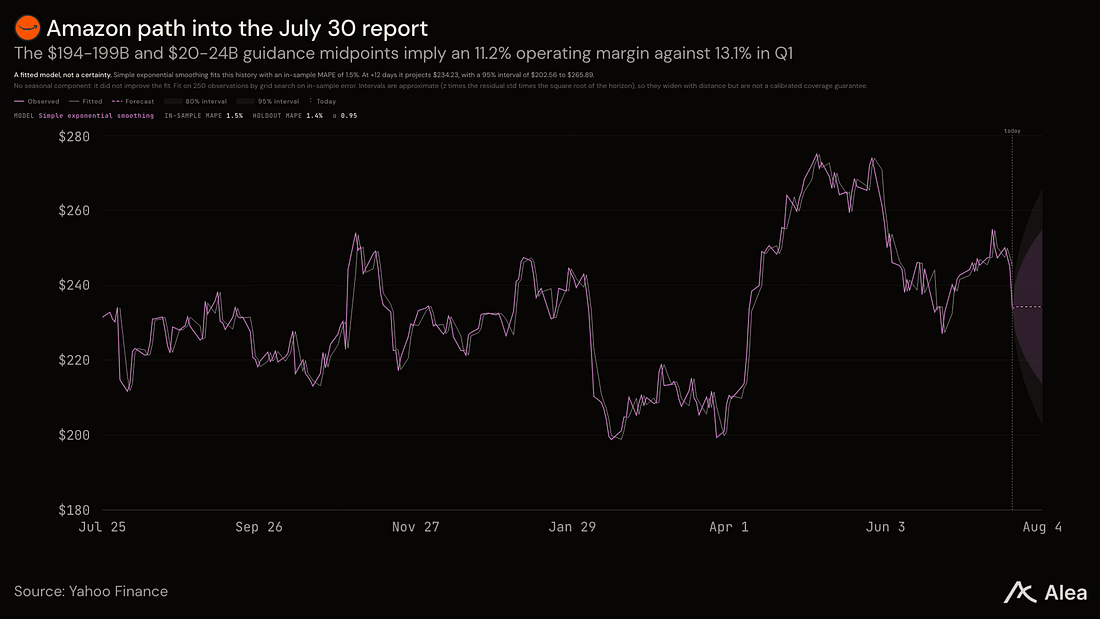
Chart: Amazon's Path Before the Earnings Report on July 30
Source: Alea Research / Substack
免责声明:本文章仅代表作者个人观点,不代表本平台的立场和观点。本文章仅供信息分享,不构成对任何人的任何投资建议。用户与作者之间的任何争议,与本平台无关。如网页中刊载的文章或图片涉及侵权,请提供相关的权利证明和身份证明发送邮件到support@aicoin.com,本平台相关工作人员将会进行核查。


