Cryptocurrency Expert: 7.31 Bitcoin (BTC) Daily Line Average Convergence Signal, Capturing the Upcoming Unilateral Launch Opportunity? Latest Market Analysis and Operational Recommendations Explained
The current price of Bitcoin is 64800. The big rises and falls have not yet appeared, and frequent fluctuations can easily lead to repeated losses. Many people cannot resist opening positions frequently; operating back and forth in the short term ultimately results in a continuous shrinkage of capital. Currently, both bulls and bears remain deadlocked, with clear upper resistance and lower support boundaries. In a volatile market, chasing rises and killing falls is most taboo; blindly over-leveraging on breakthrough bets will only lead to passive beatings. To stabilize profits at this stage, one must patiently wait for clear directional signals, strictly control positions, and only take action after identifying key support and resistance levels. Do not let short-term market fluctuations disrupt your trading rhythm.
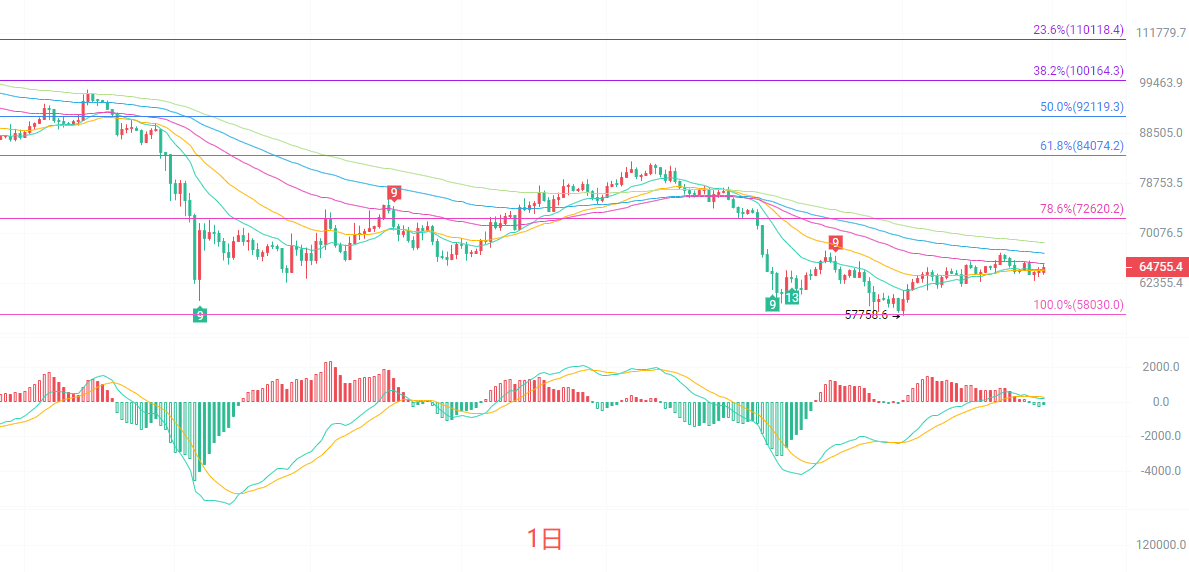
The daily K-line is in the rebound recovery range from the previous low of 57758. The EMA15 has formed short-term support at 64415, and the moving average system is flat. The bulls have not formed a strong upward arrangement. The Bollinger Band continues to narrow, indicating that a large-scale trend reversal window is approaching. The MACD indicator’s DIF is close to DEA, with a weak increase in red bars, and the upward momentum is diminishing. From the Fibonacci indicators, the current price is within the rebound range of 58030 to 70501, with the first resistance above at 72620 and core support below at 58030. Until there is an effective breakout at the daily level, the overall situation is still defined as a box oscillation pattern after a bottom rebound.
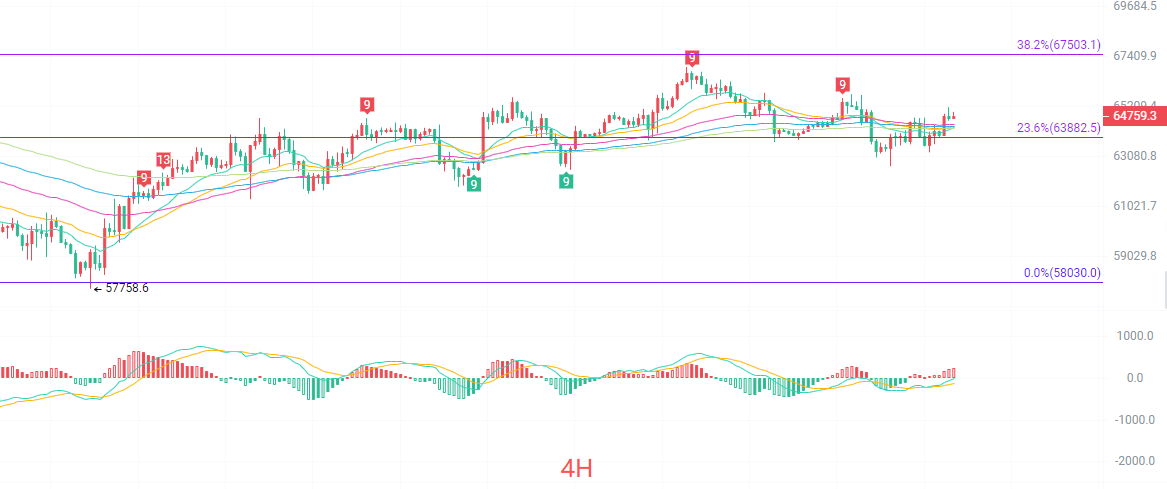
The four-hour K-line is steadily operating above the EMA15 and EMA30 moving averages, with a short-term moving average forming a support band in the 64295-64342 range. The middle track of the Bollinger Band at 64085 continues to support the market, and the upper and lower tracks are continually narrowing, resulting in a compressed volatility range. The MACD maintains a gentle bullish structure, with a slight continuation of red bars and no occurrence of top divergence signals. The Fibonacci 23.6% level at 63882 is becoming a strong support recently, with short-term resistance above at 67503. The market's oscillation center is slowly rising, and the short-term bulls occupy a slight advantage, but the upward momentum is insufficient, making it temporarily difficult to establish a continuous unilateral upward trend.
Short-term Reference:
If it does not break below 64500 to 64000, go long with a stop loss at 63500, targeting 65500 to 66500.
If it does not break above 67000 to 67500, go short with a stop loss at 68000, targeting 66000 to 65000.
Specific operations should be based mainly on real-time data from the order book. For more information details, you can consult the author. The article's publication has delays; suggestions are for reference only, and risks are to be borne by the reader.

Warm Reminder: The above content is solely created by the author of this public account. Advertisements at the end of the article and in the comment section are not related to the author. Please be cautious and discern carefully. Thank you for reading.
免责声明:本文章仅代表作者个人观点,不代表本平台的立场和观点。本文章仅供信息分享,不构成对任何人的任何投资建议。用户与作者之间的任何争议,与本平台无关。如网页中刊载的文章或图片涉及侵权,请提供相关的权利证明和身份证明发送邮件到support@aicoin.com,本平台相关工作人员将会进行核查。